rainhARvest
An AR data visualisation on amount of rainwater one can save at home
Introduction
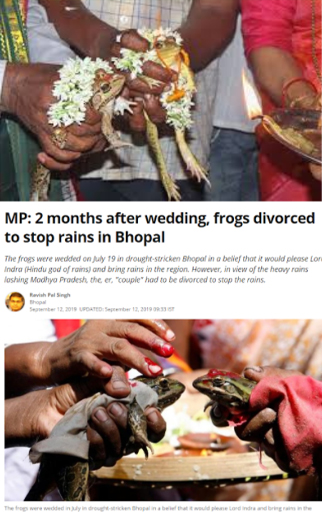
Rainwater hARvest is an AR data visualisation, that helps in visualising the amount of rain water that can be harvested in a circular area of radius 3 inches across different states and different months in India. This project was done under the mentor of Pritam Pebam, Google Lens Design Lead.
The Design Process followed

Competitive Analysis
Competitive analysis is a UX research method that is used to identify and create knowledge of strengths and weaknesses of other competing products and services. The insights gained from the analysis can be used to add value to the product under development.
Analysis of some augmented reality application are done to better understand augmentation on following basis-
- Visual affordance in AR applications
- Interaction with AR application
- What kind of understanding it brings
- Other Insights
Applications are analysed in this presentation- PaintSpace AR Player, Roomle 3D, Mindmap AR, RC Helicopter AR and Satellite AR.
Other apps analysed include-AR real animals, Holo, AR elements, AR watches, Assembler, ARuler and X Drum.

All the apps are installed on Android 9(Pie) Mobile Phone with 4GB RAM, 6.3 inch display and 48MP primary camera.
Insigts of Competitive Analysis-
- Most AR application has onboarding (coaching screens, labed signifier overlays and in boarding), coaching overlays, splash screen and off screen exploration icons for easy interaction with the system.
- They avoid pops and have different methods for error handling.
- Most virtual objects possess metaphorical and hidden affordance.
- There are various method for object manipulation.
- Min-max value is generally defined for object scale.
- Virtual object interacts with the physical environment(like shadows, surface detection , occlusion etc).
- These applications can controlled user movement in physical space.
Primary Research
The primary research was conducted via online survey forms( with 65 responses). Most of the survey volunteers were 18- 30 years old, some 31- 50 years and a few above 50 years. They were from Madhya Pradesh(Agar malwa, Balaghat, Bhopal, Hoshangabad, Jabalpur, Khargone, Sagar, Khandawa, Barvani, Gwalior, indore, Khargoan ), Andhra Pradesh, Assam, Bihar, Jharkhand, Haryana, Maharastra, Punjab, Rajasthan, Tamil Nadu, Telangana, UP, Uttrakhand.
The insights obtained were-
- Water shortage is big problem faced atleast once by Indian residents.
- In Madhya Pradesh very less houses have a RWH system at home. (10% among survey volunteers)
- Most of the people in Madhya Pradesh are unaware of government measures like ‘Mandatory Rainwater harvesting for all buildings having building area of 250 sqm or more from 2001/02 in Indore’. (65% among survey volunteers)
- Most of the people have experienced floods in india.
- Most people think RWH is to save water for future use, very less people think about RWH for ecological balance, groundwater recharge, farming, a source of freshwater etc.
- A 19 year girl from rural MP wrote about an event when she was younger than 14 years that she has seen farmers having long gap between harvest of rabi crops and scarcity of drinking water problem.
- A resident of Bhopal, MP above 50 years wrote that in summer water comes only half an hour a day.
- A man in his 40’s from Indore wrote that it is the biggest problem here.
- One person from Indore in his 20’s wrote that in summer the borewells are dried, the government water supply is not enough so they rent water tankers 5-6 times a year.( 1 liter cost around 20-30 INR).
Problem Statement
Users need to know the amount of rainwater they can harvest because many of them don't know the amount in terms of capacity to visualise.
Target Audience
Common Indian residents with permanent settlement.
Age group - 18 years and above.
Brainstorming
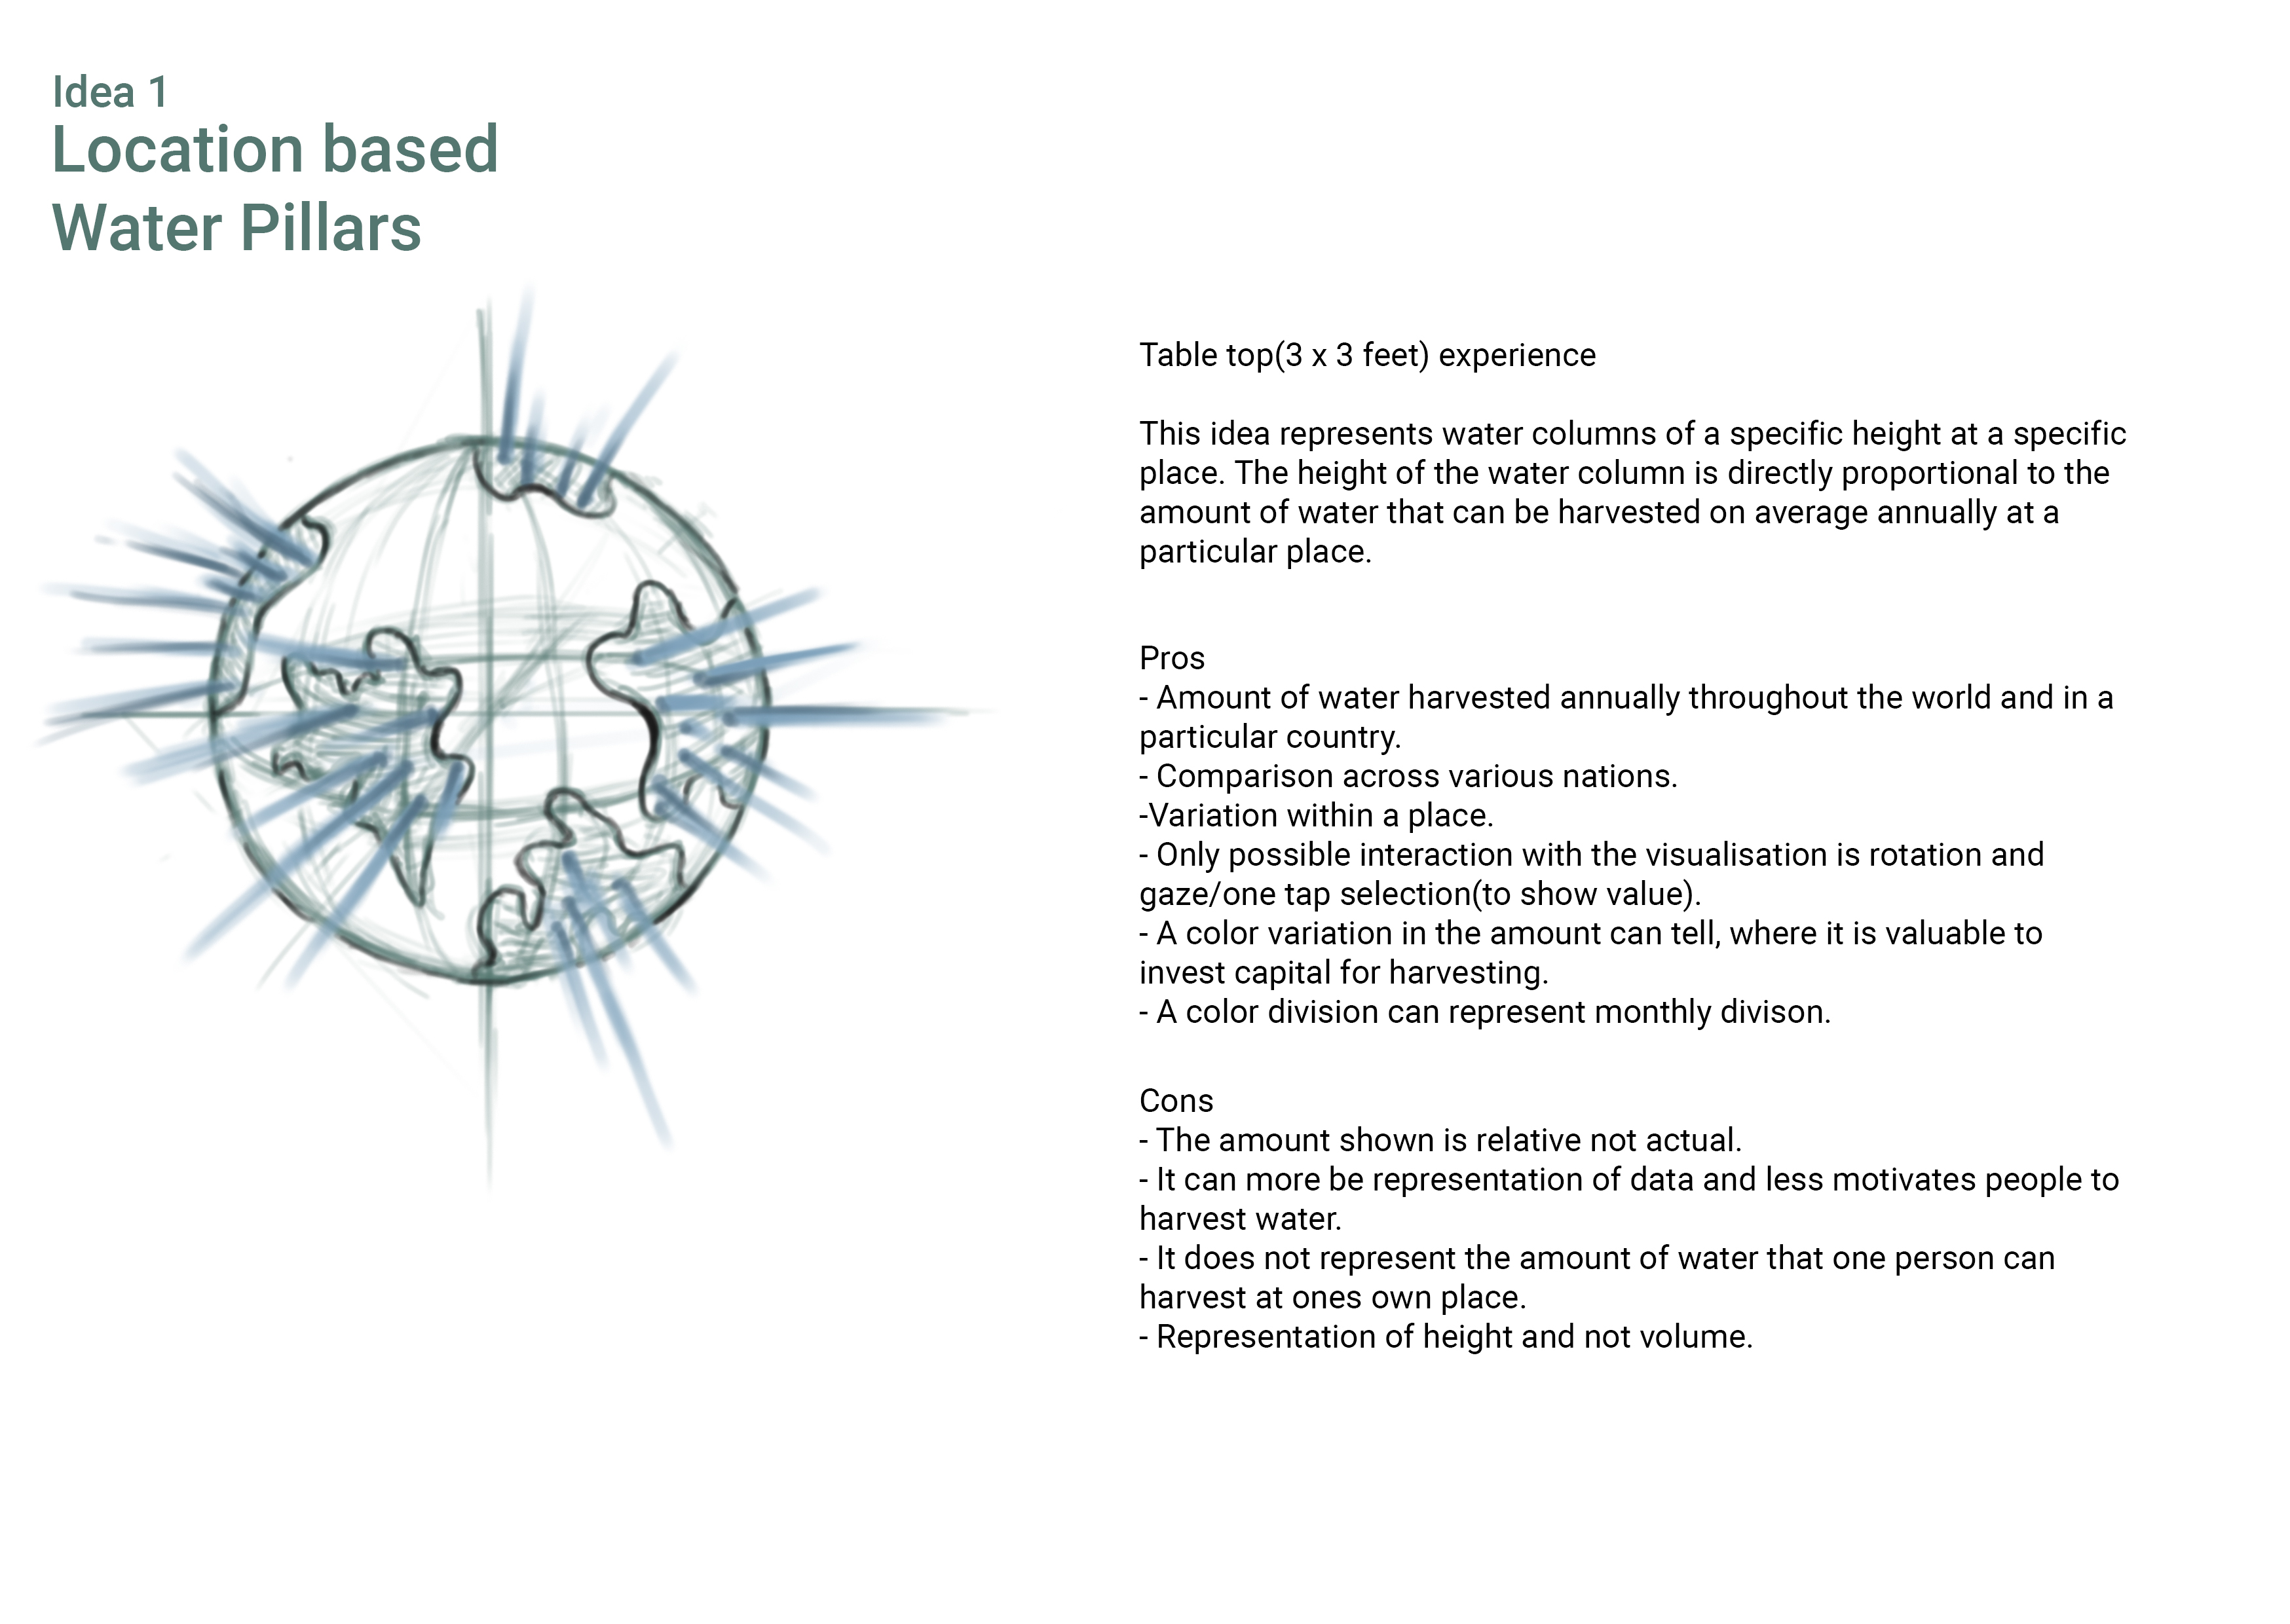
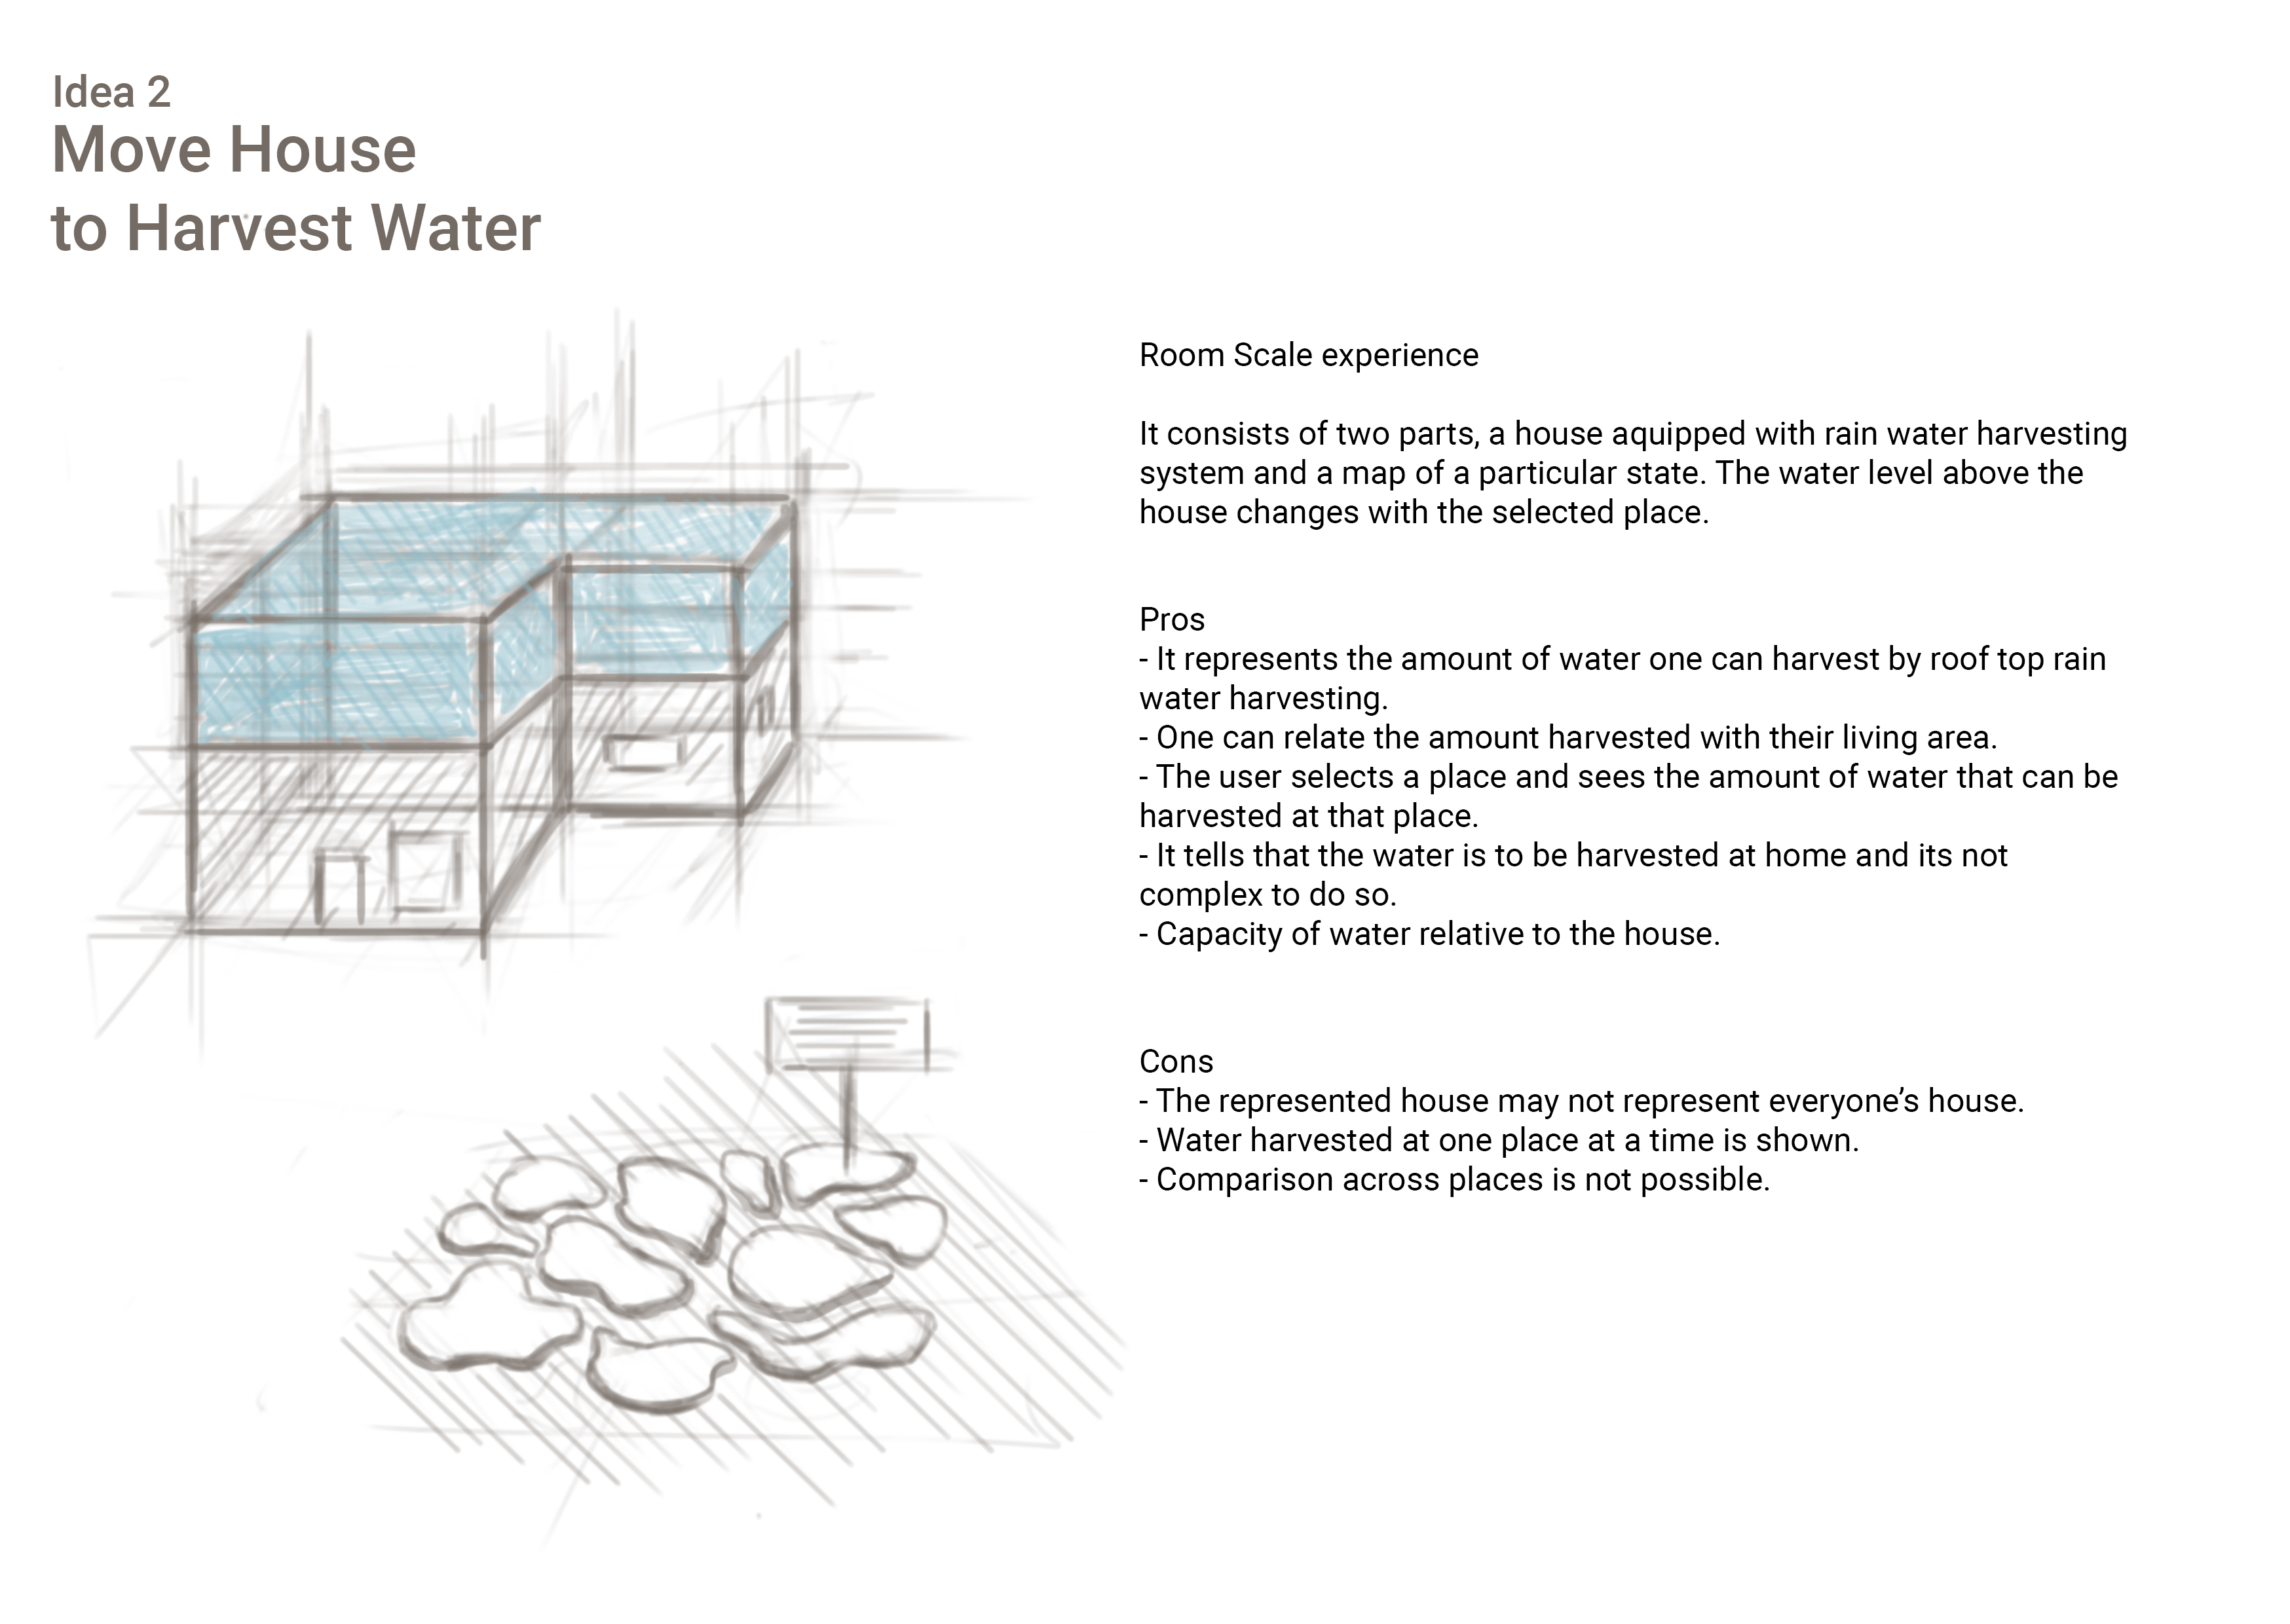
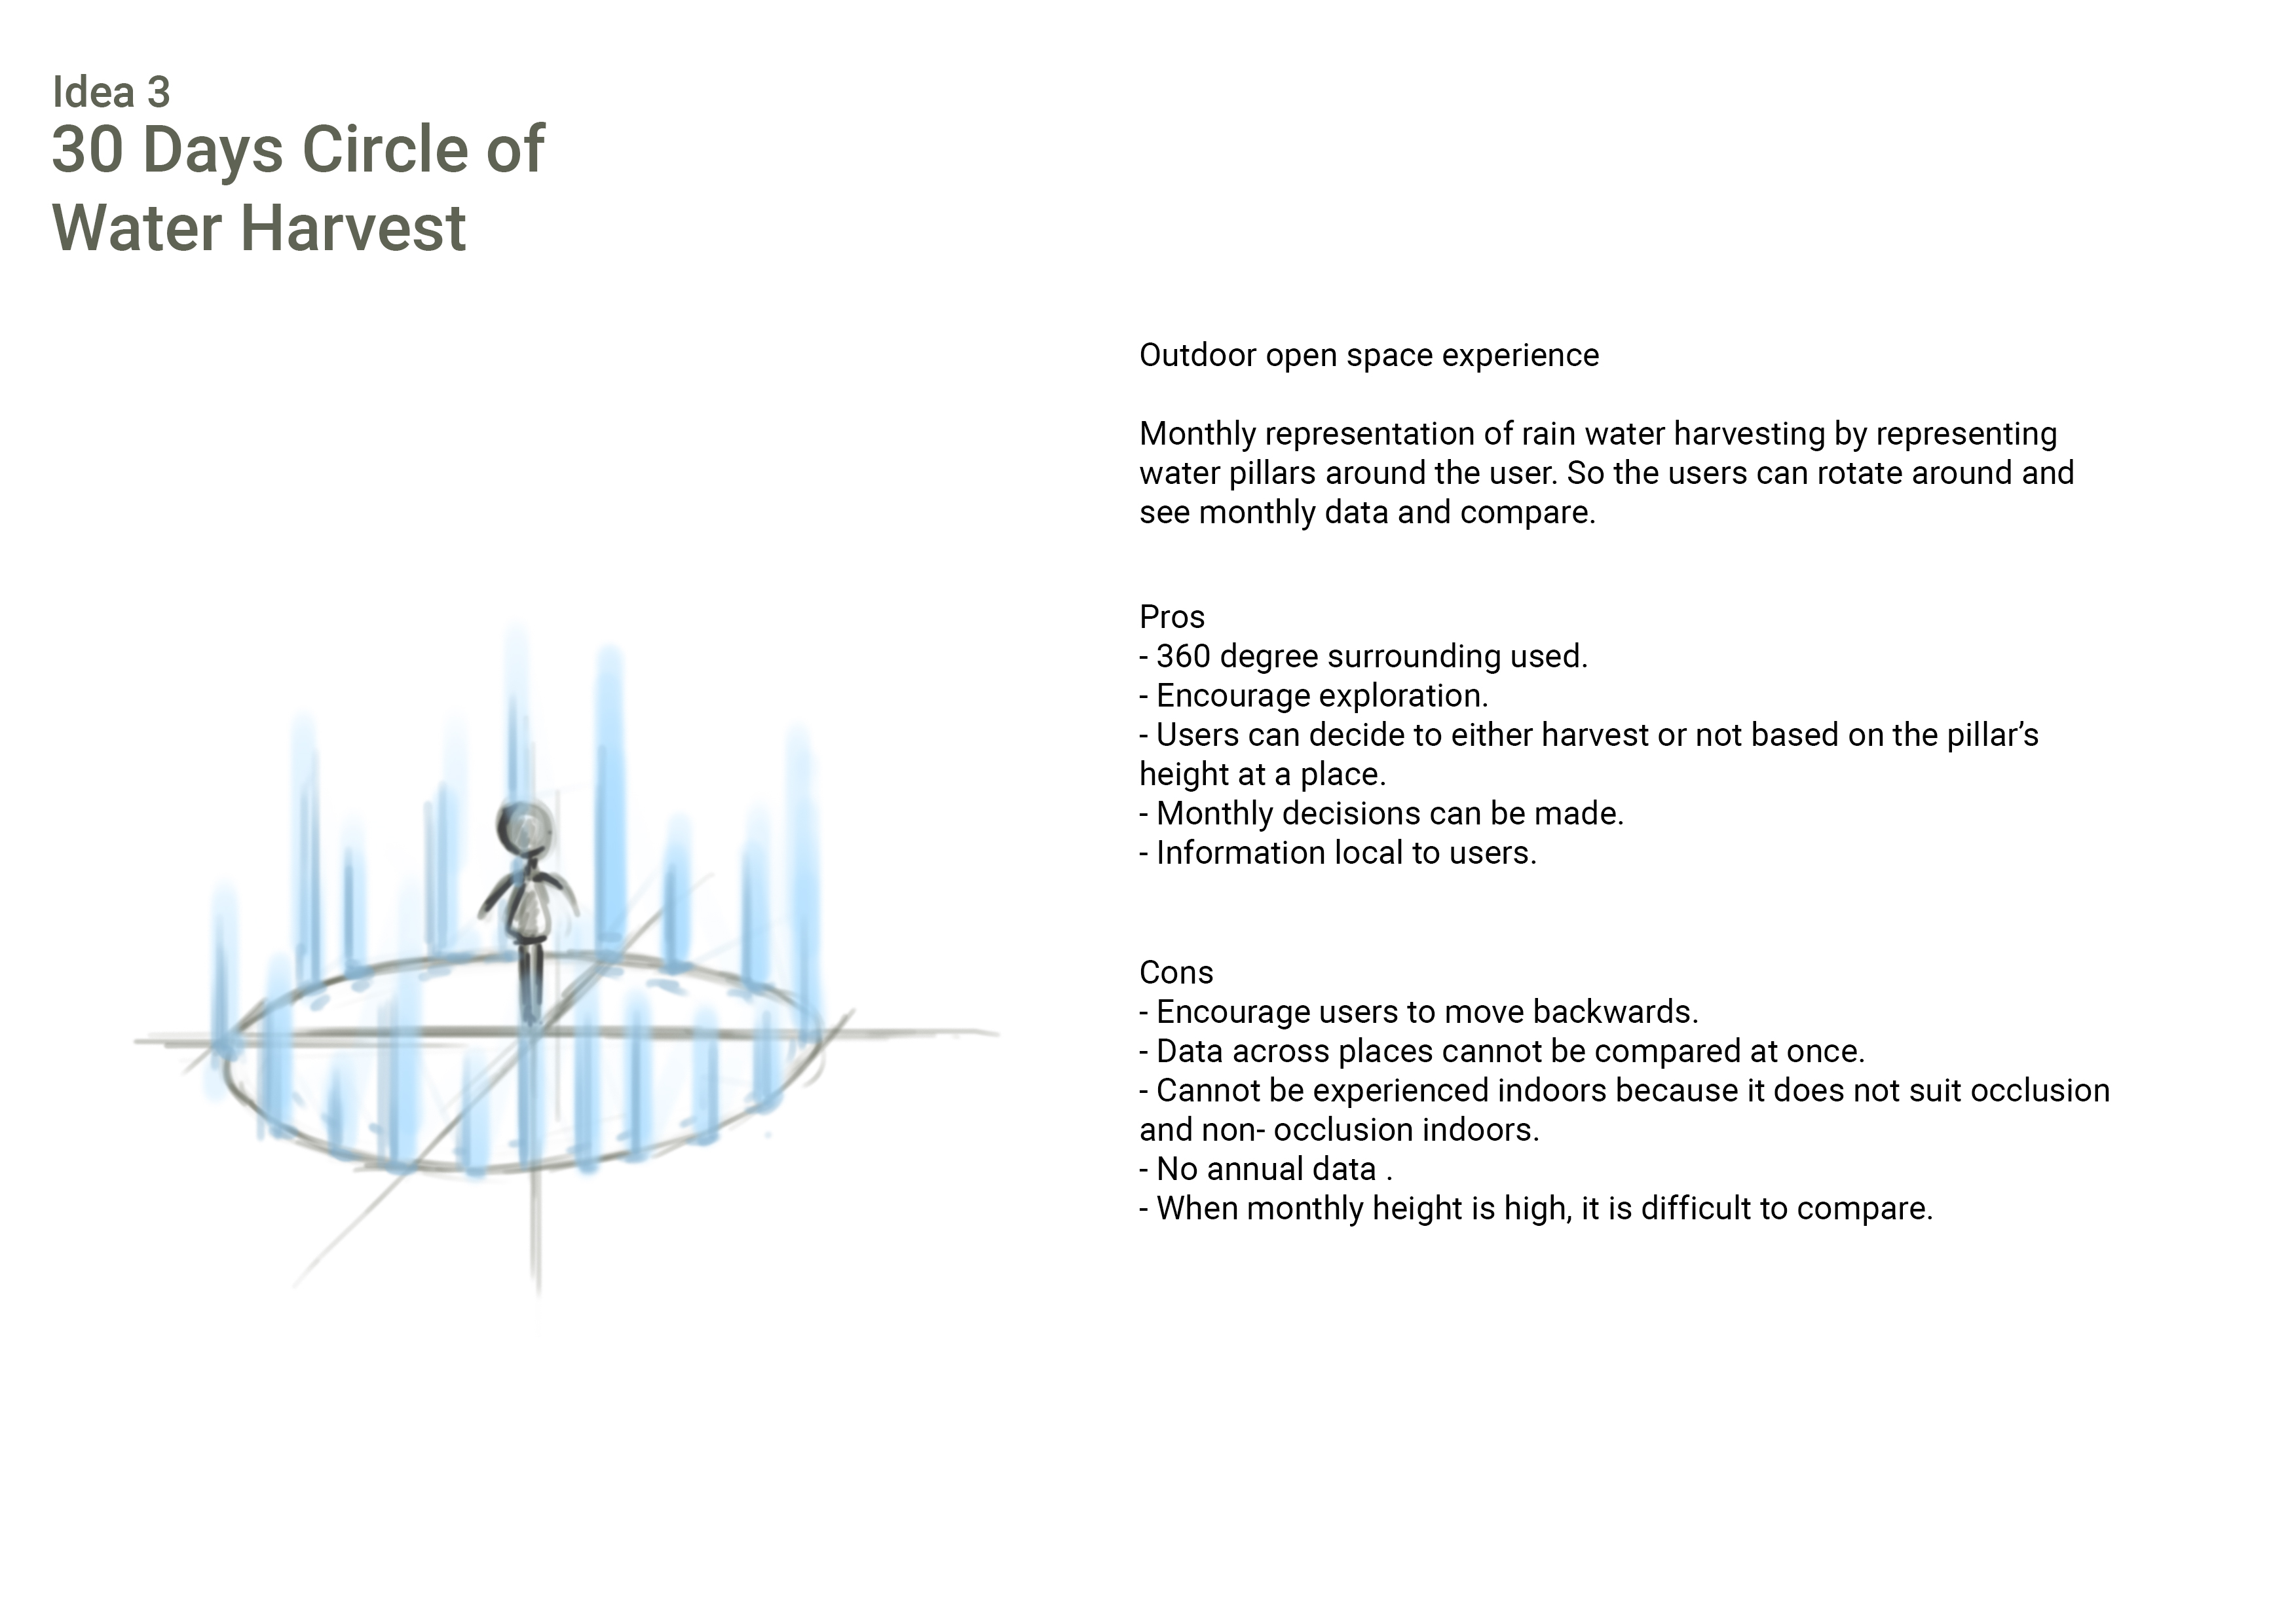
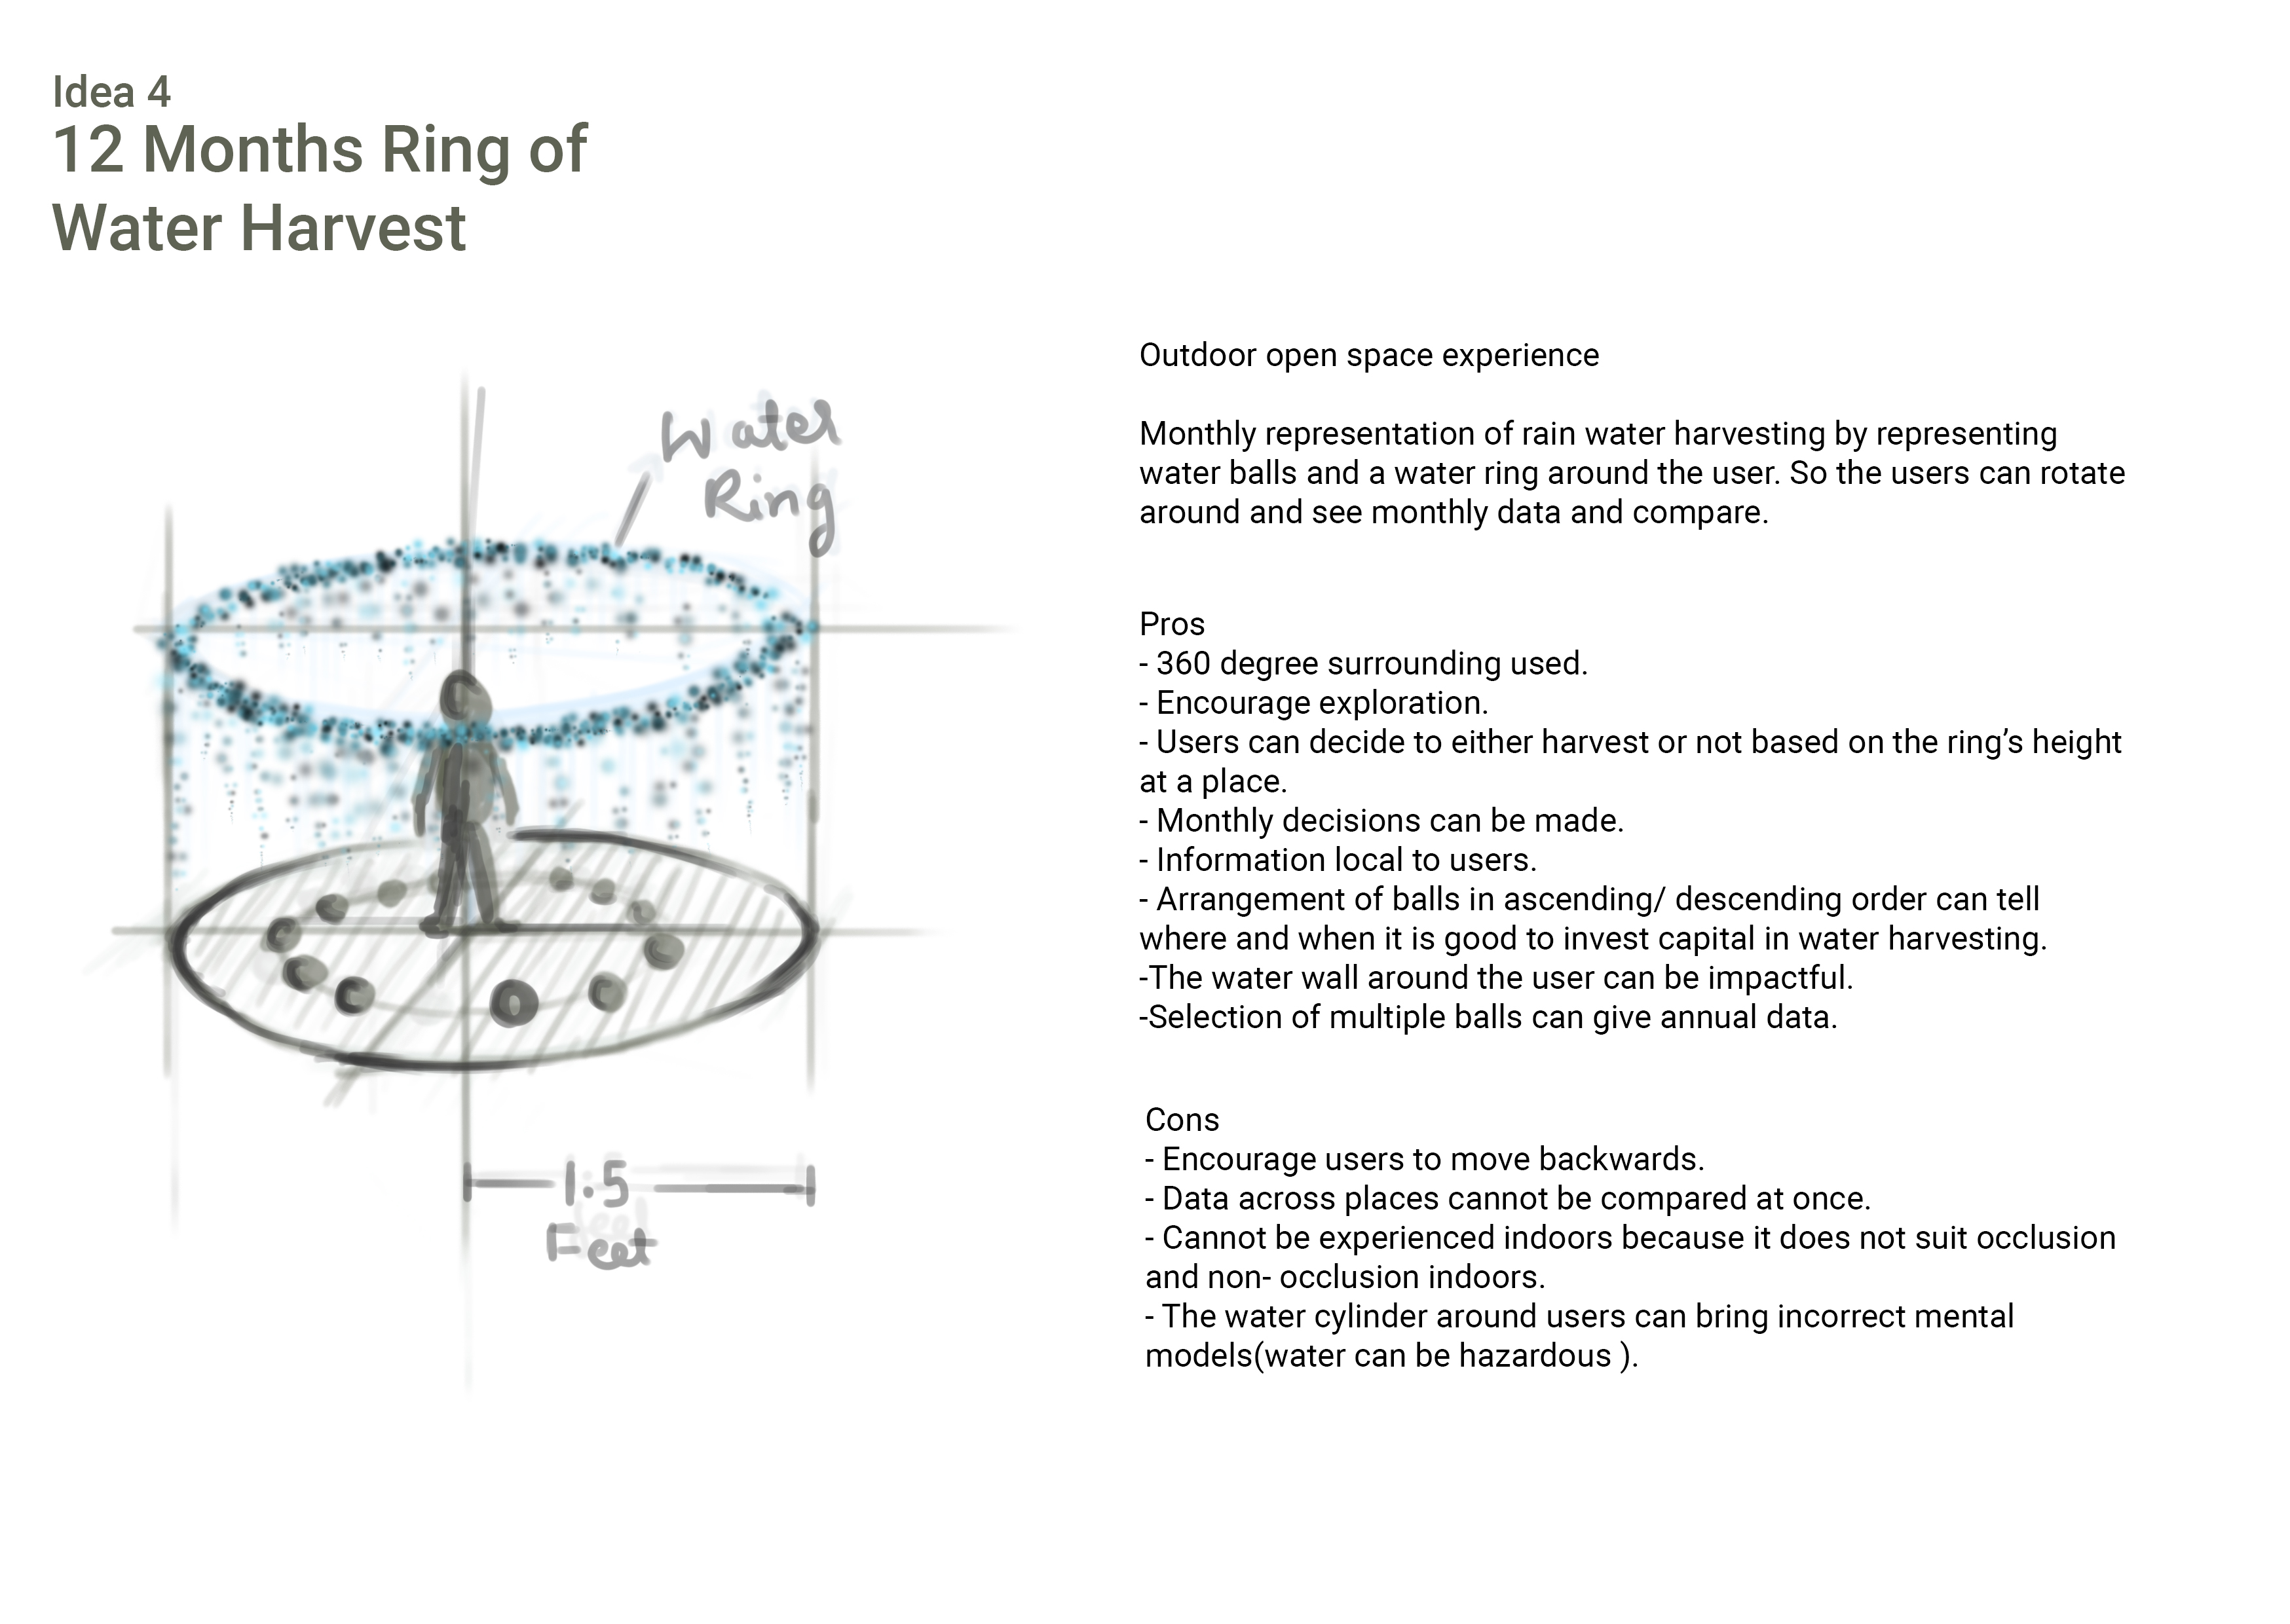
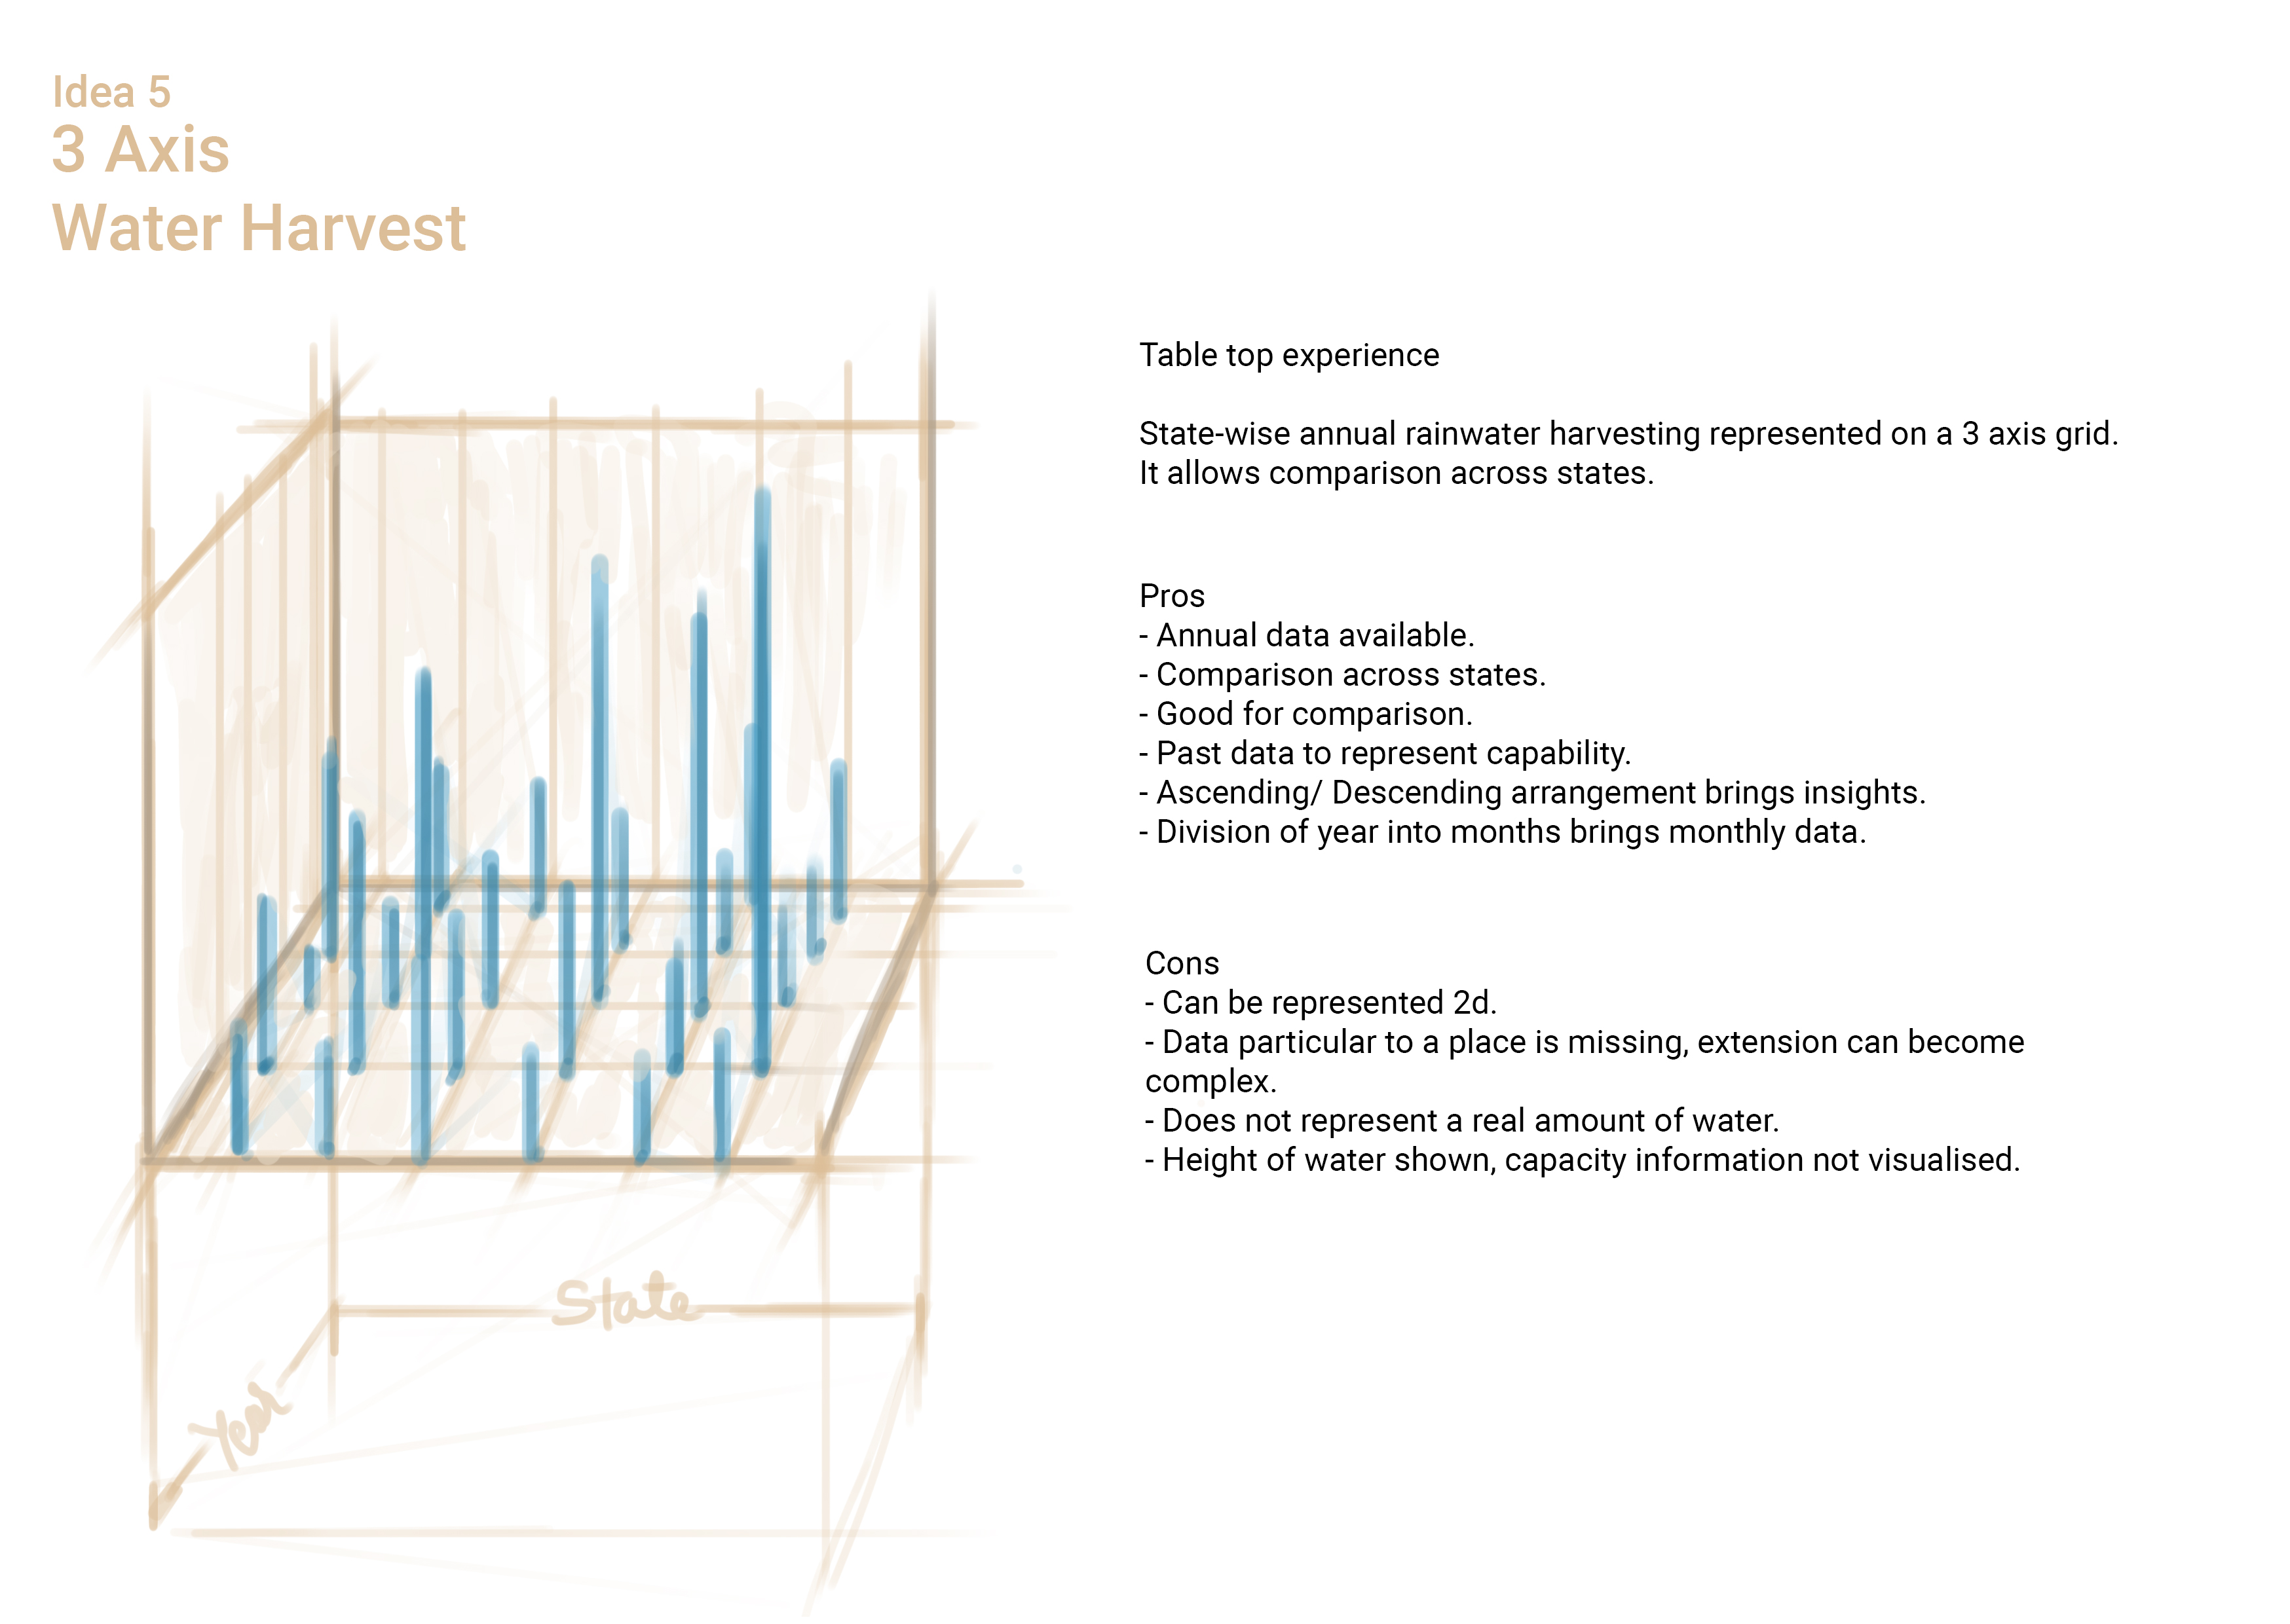
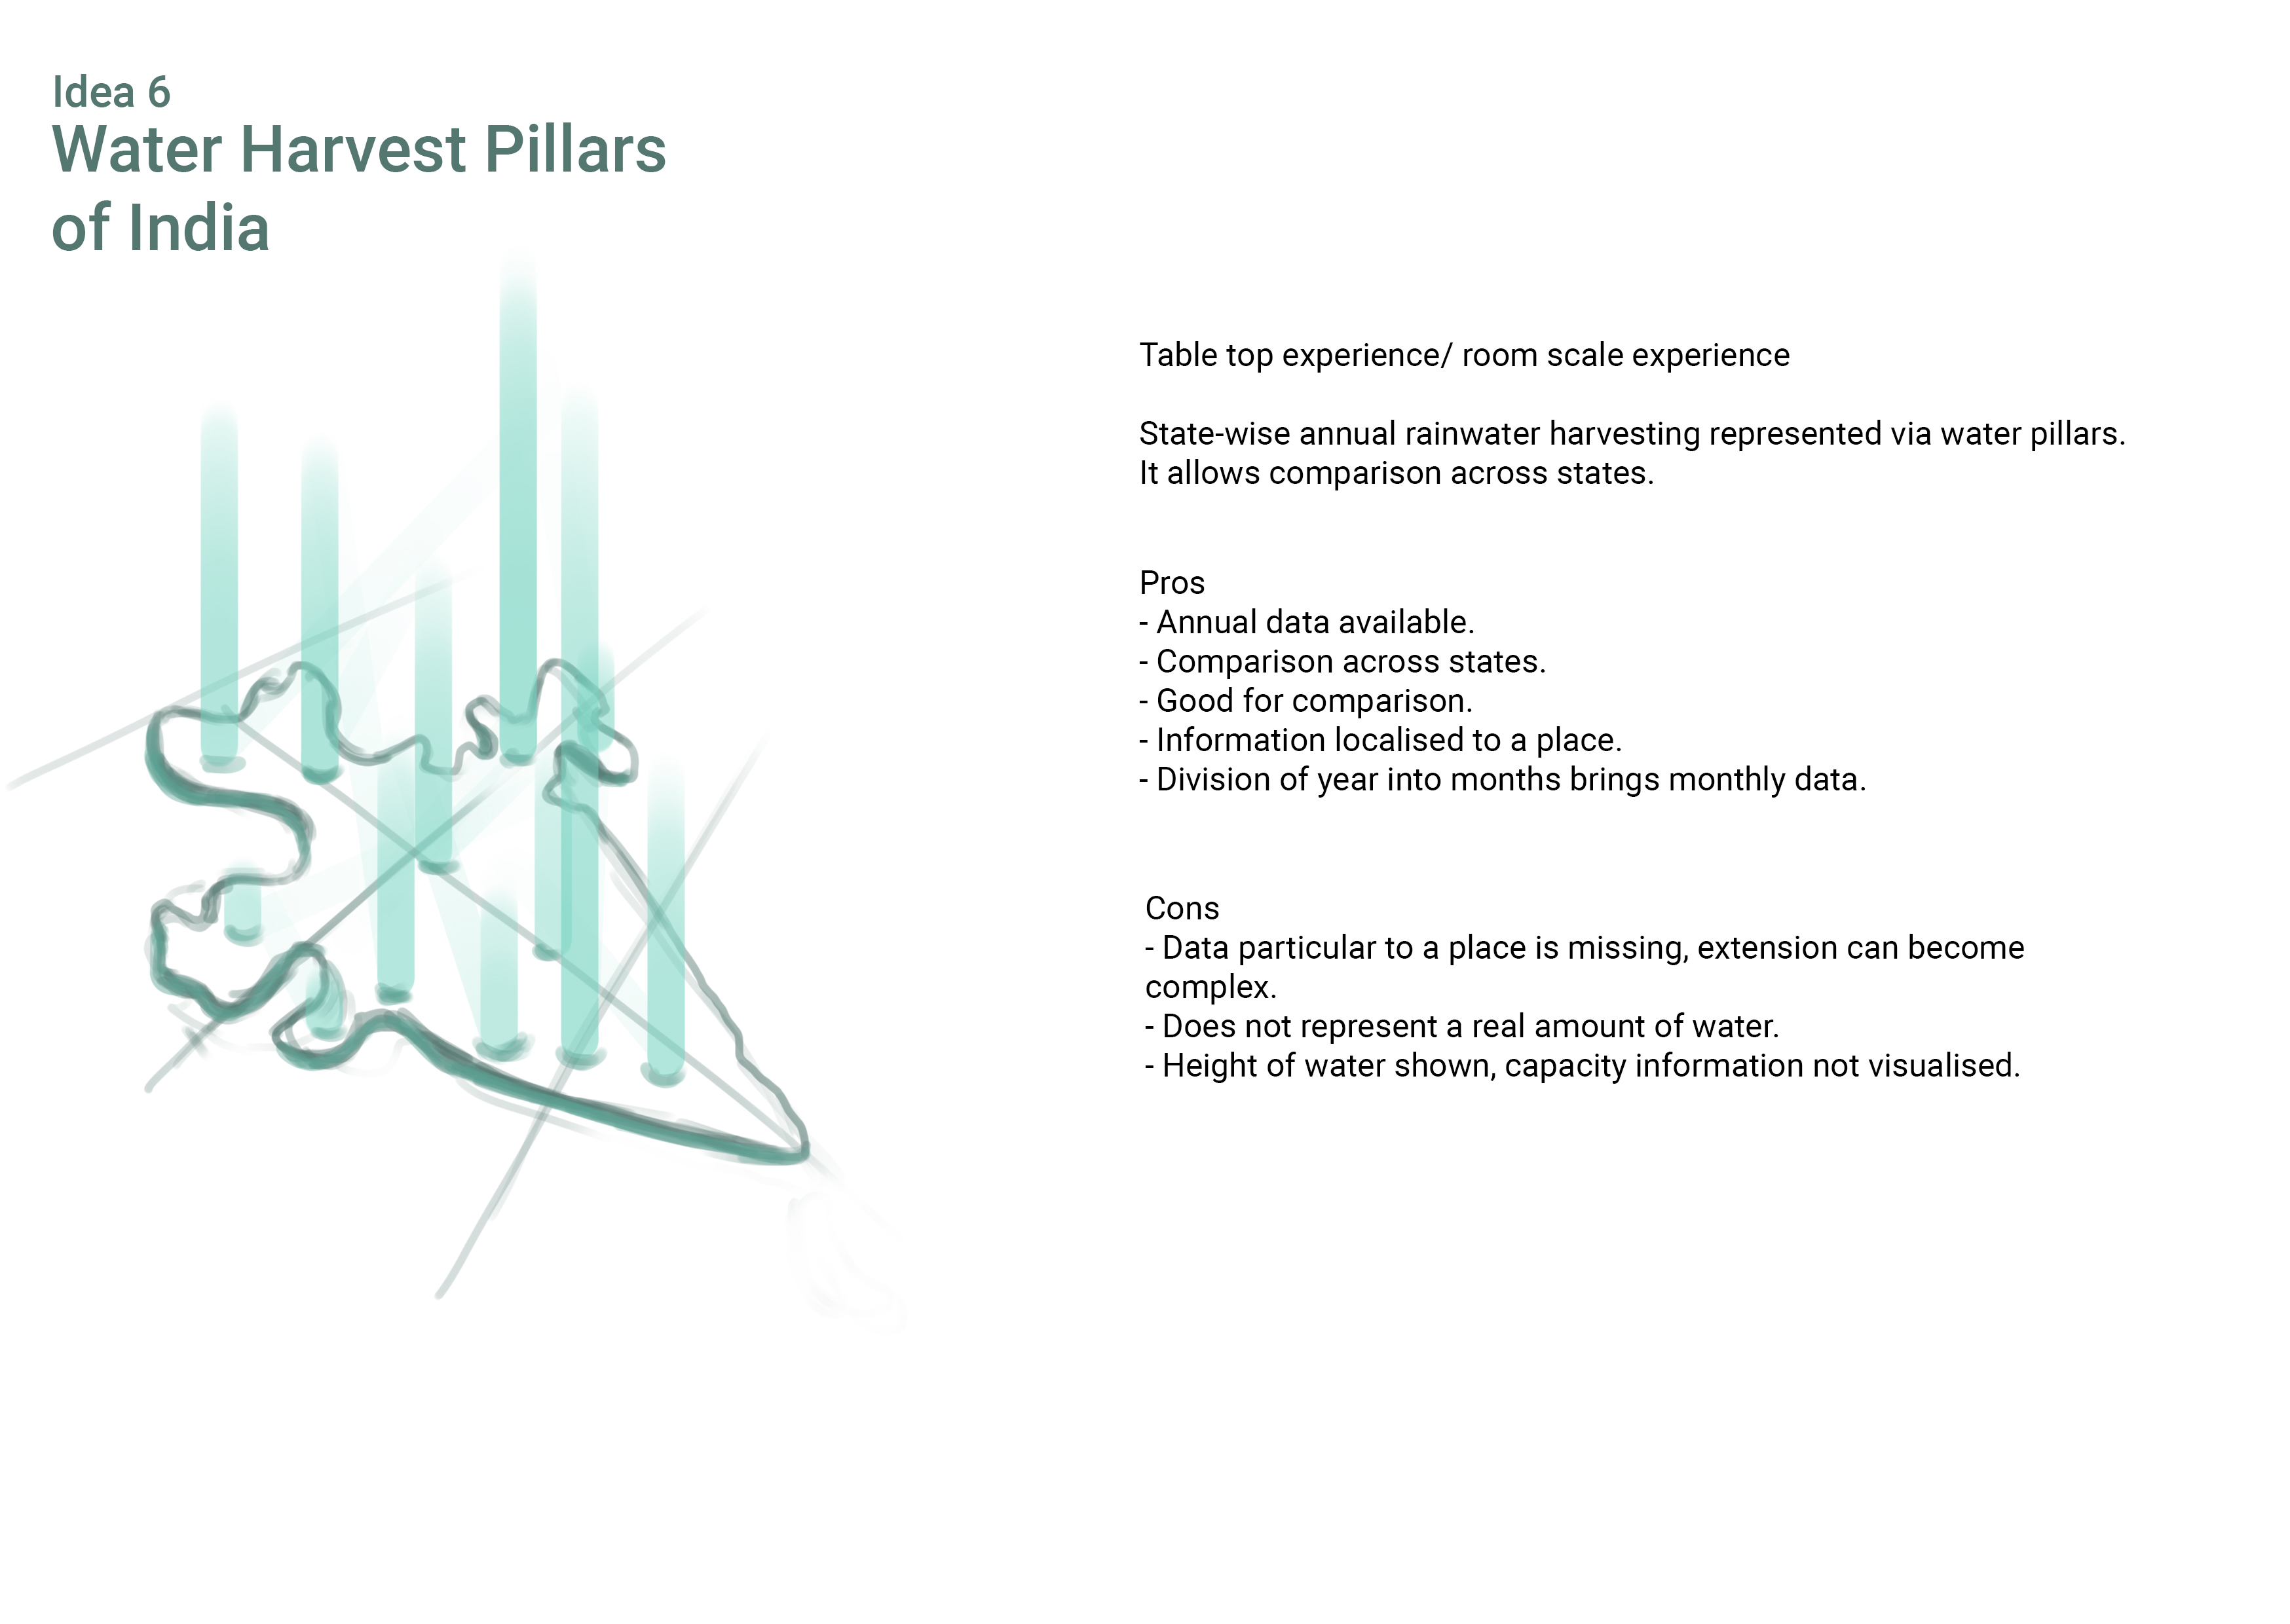
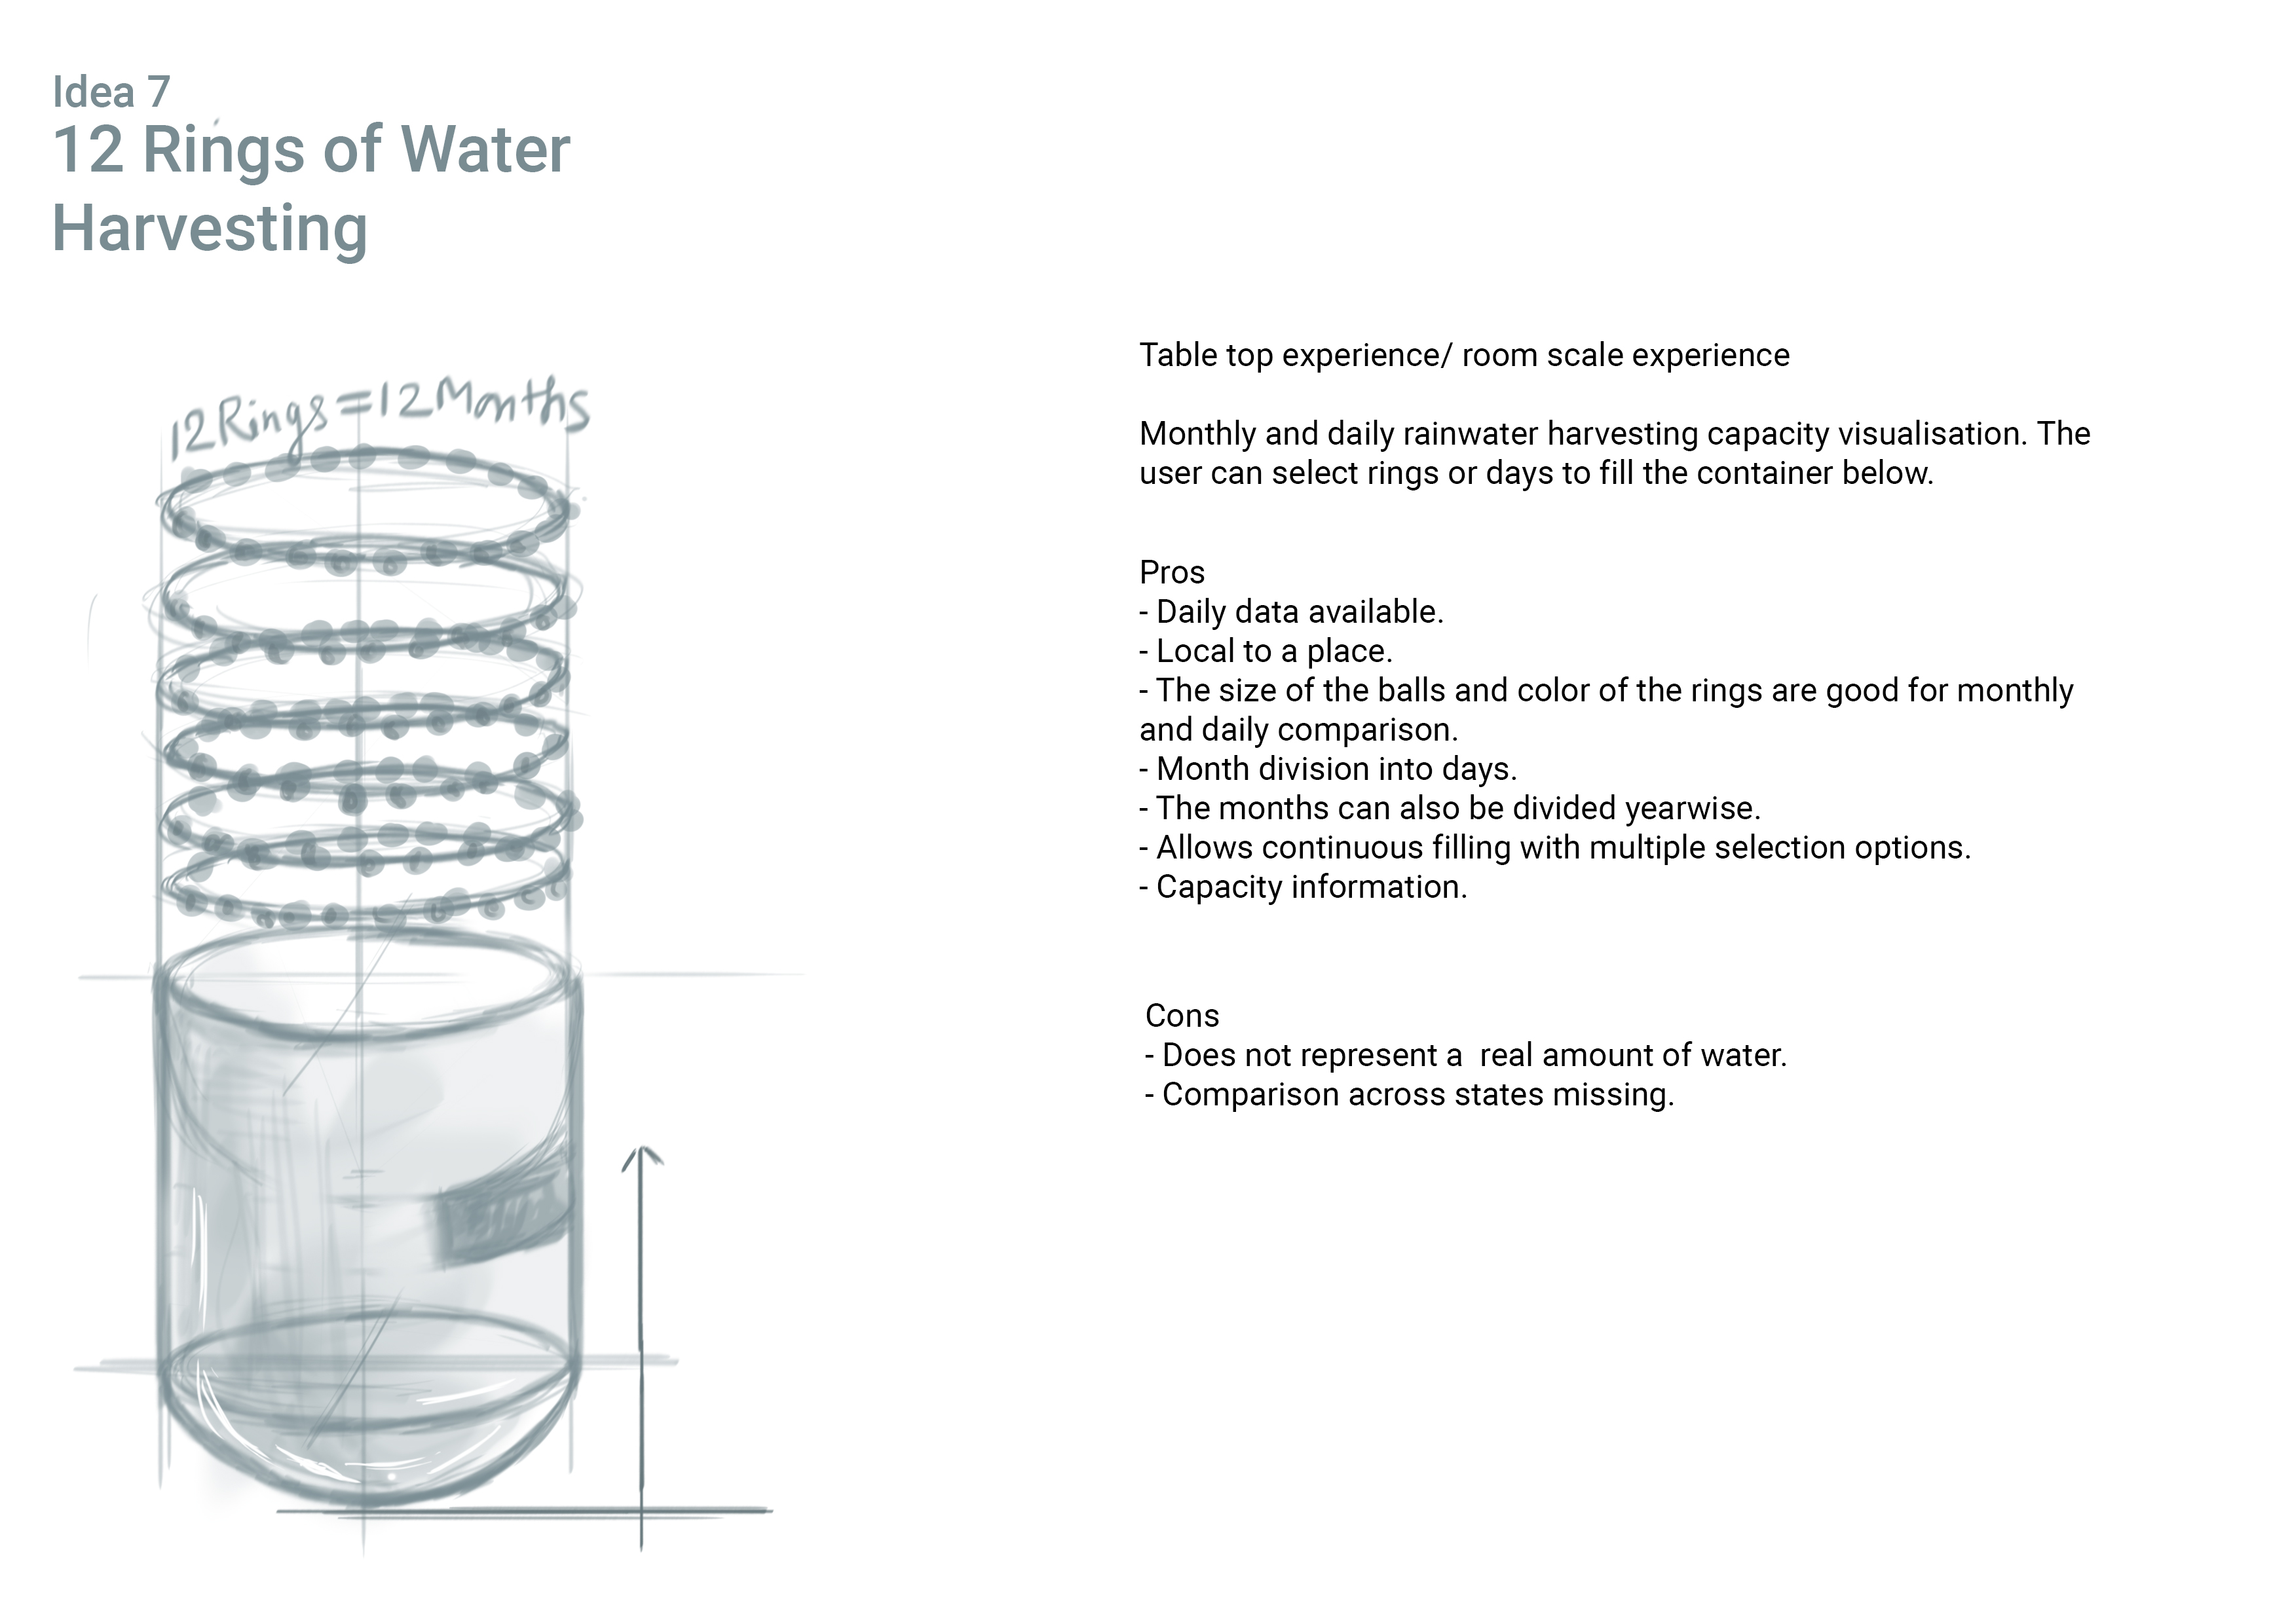
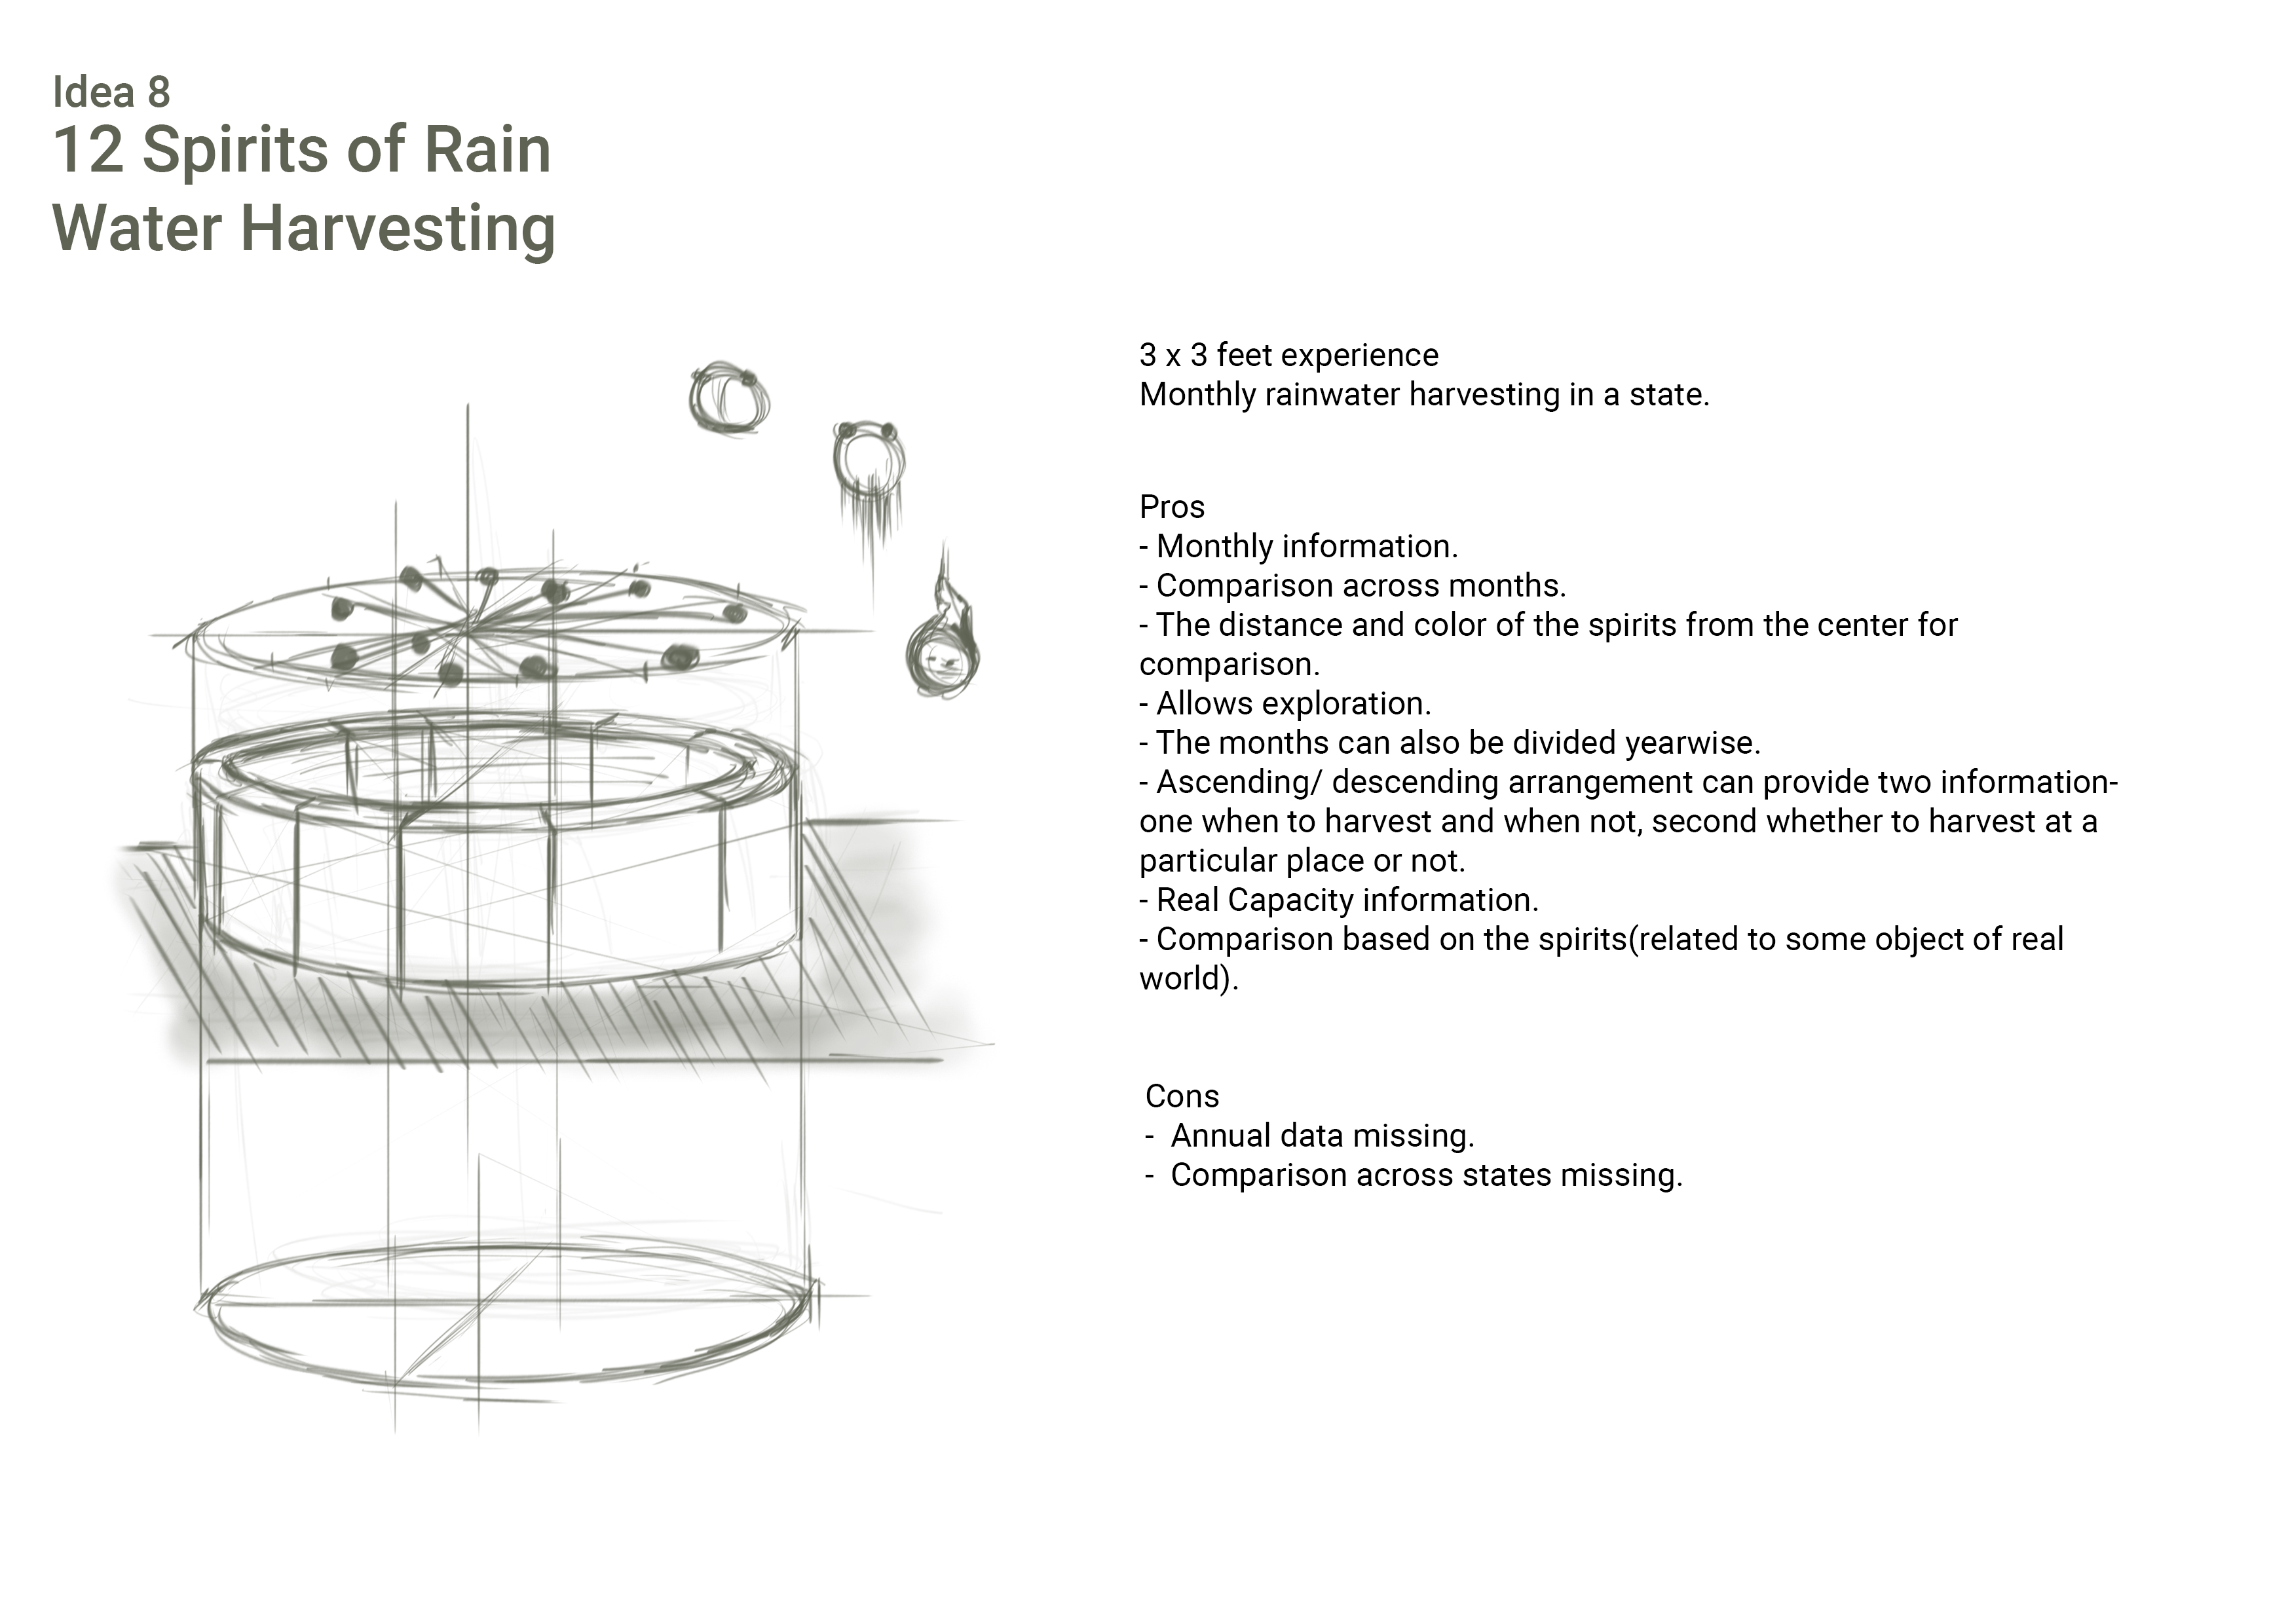
Final Concept
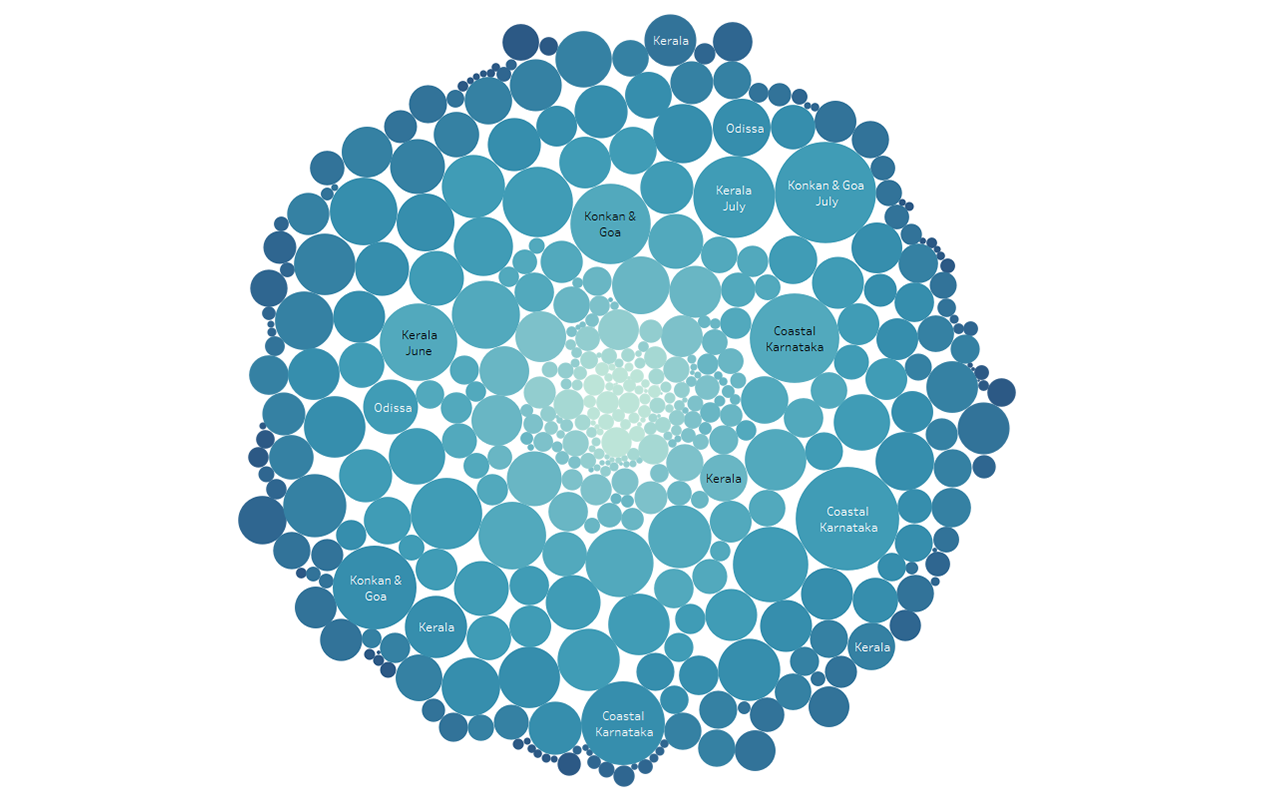
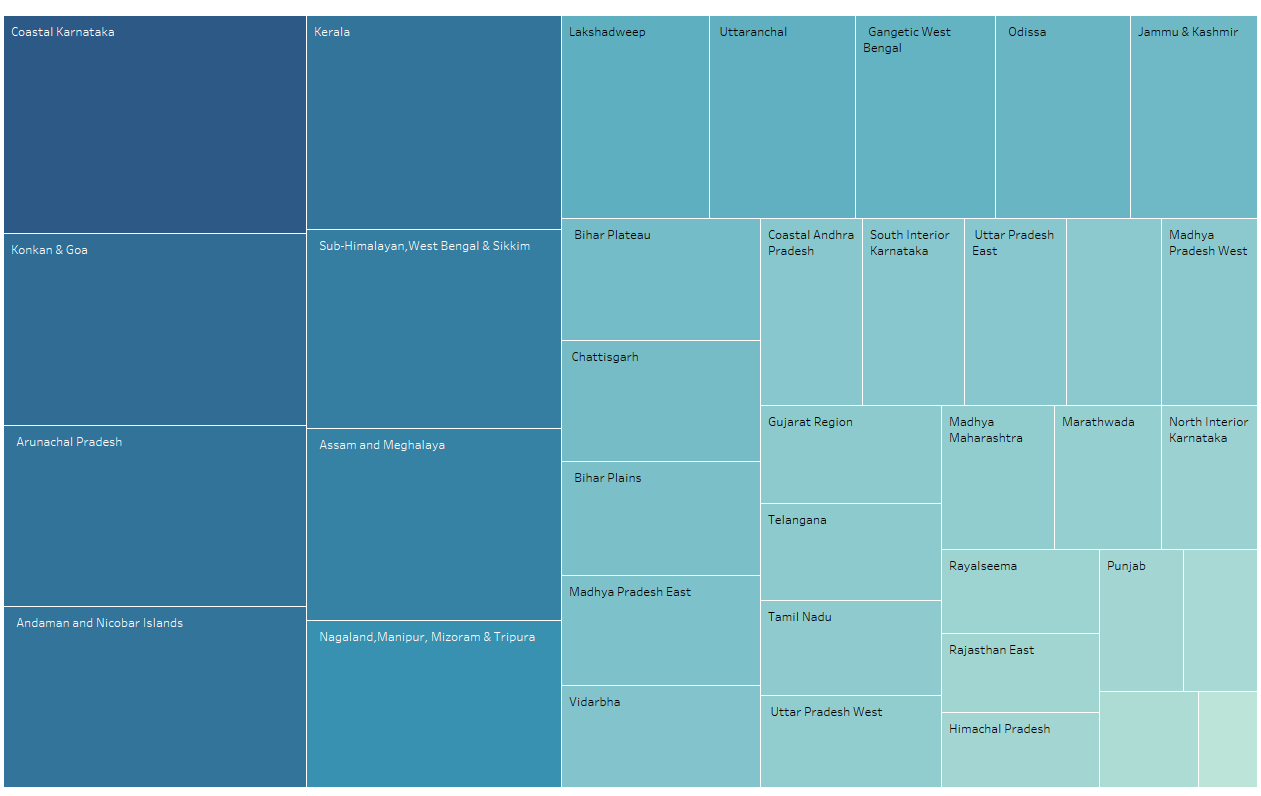
Understanding the rainfall data of India by data visualization( using Tableau)
Sketching and ideating on the final concept
Paperwork and ideation for layout
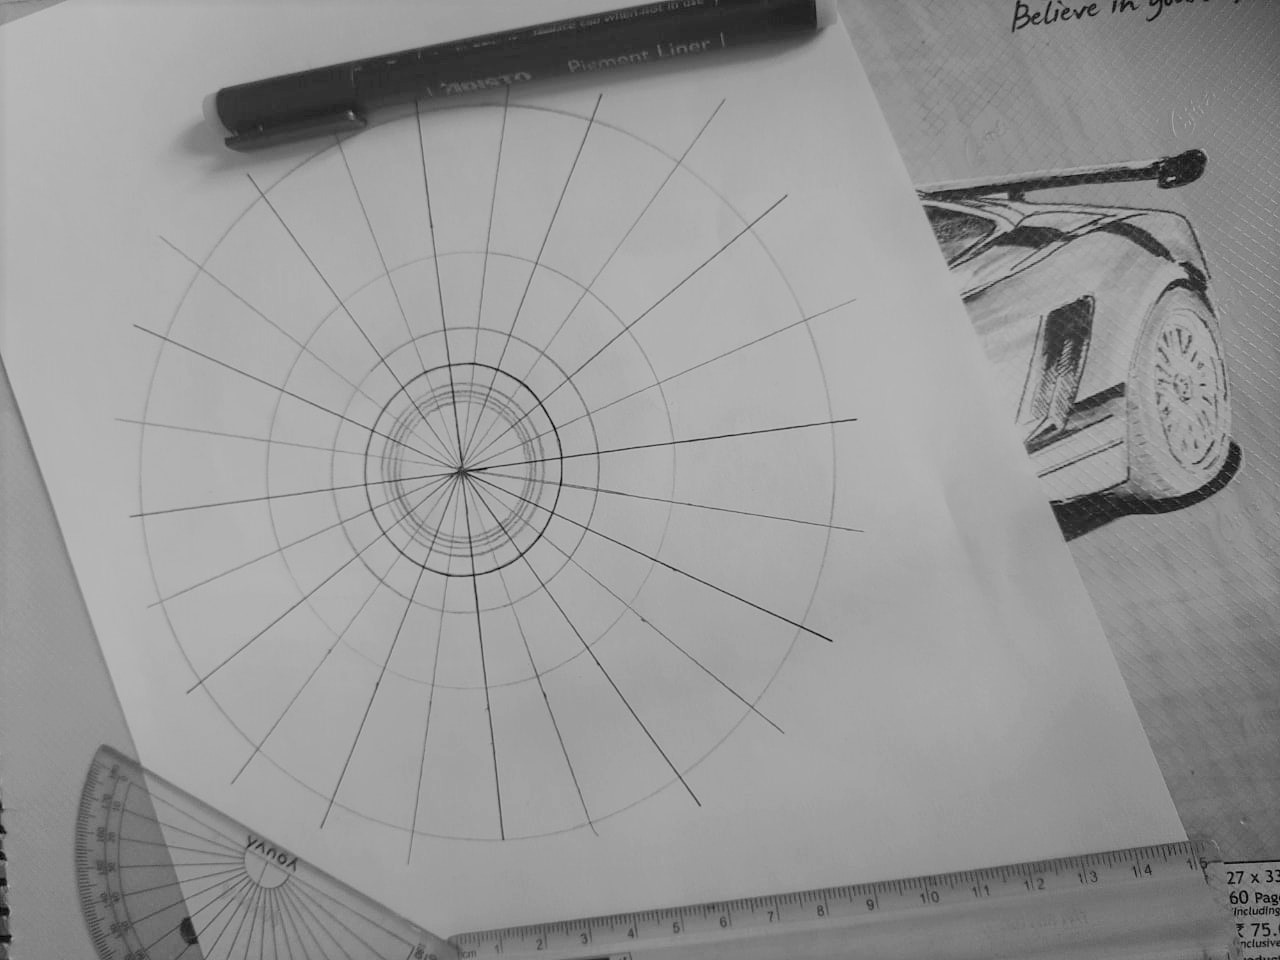
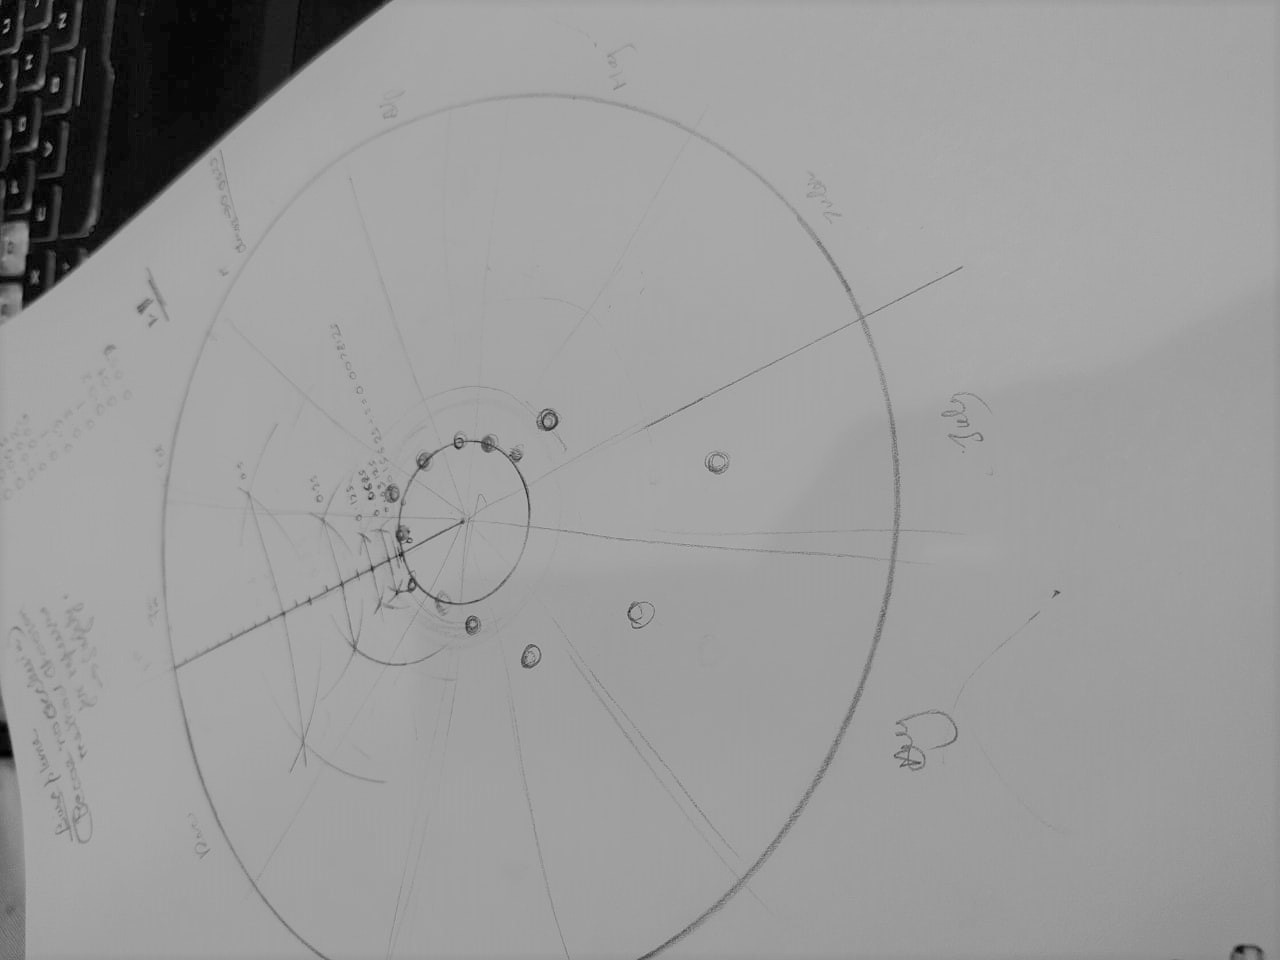
Paperwork for radial and sector division
Data points plotting over layout(top view)
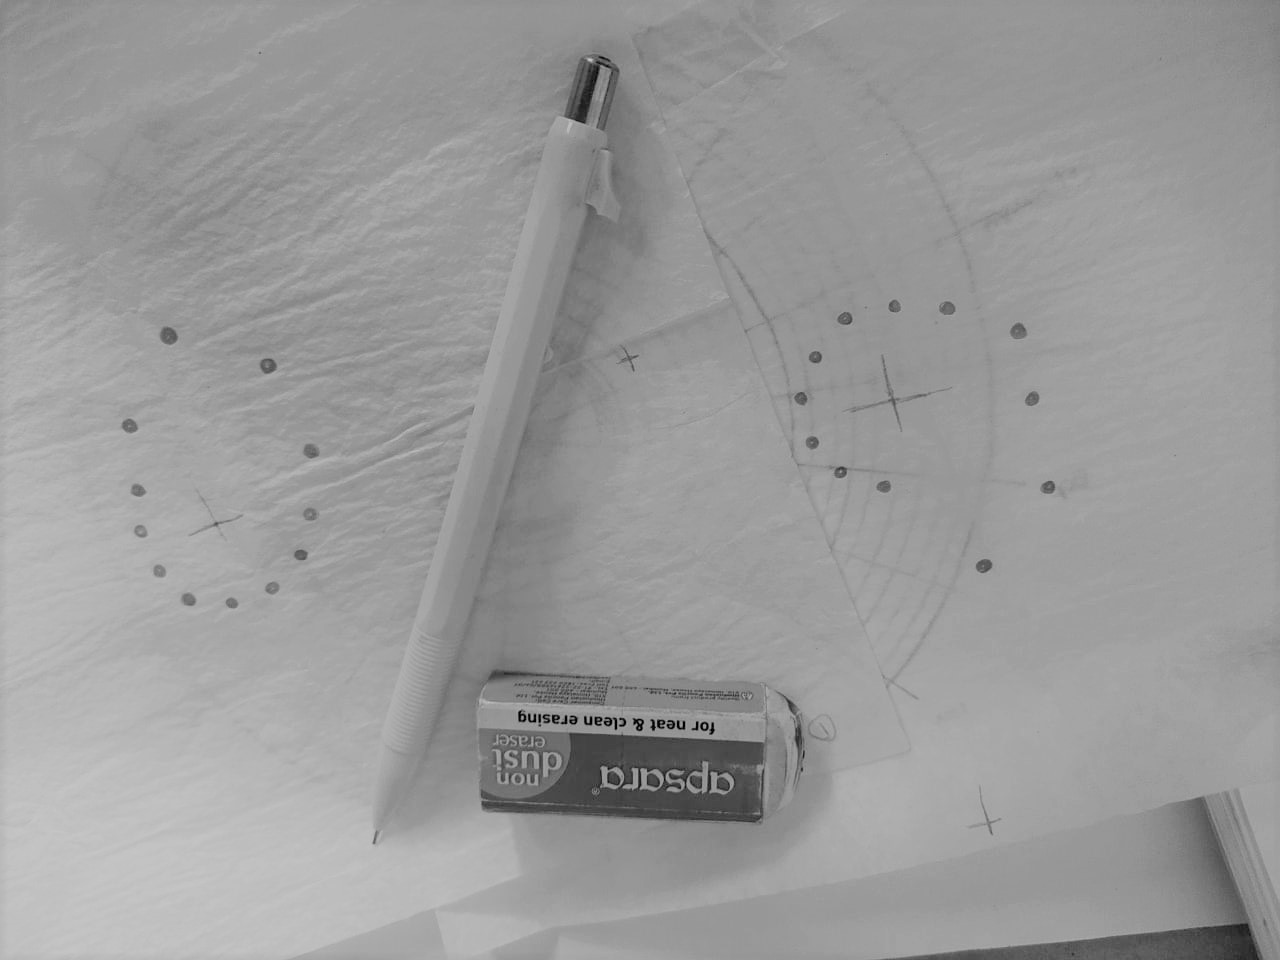
Variants of data point placements
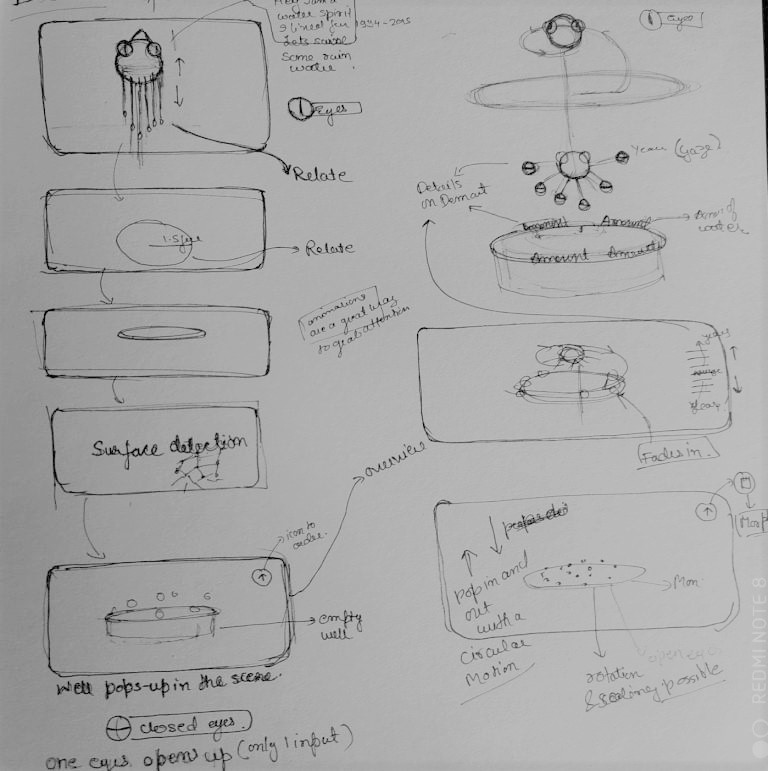
Navigation flow
Style and treatment
Color Scheme

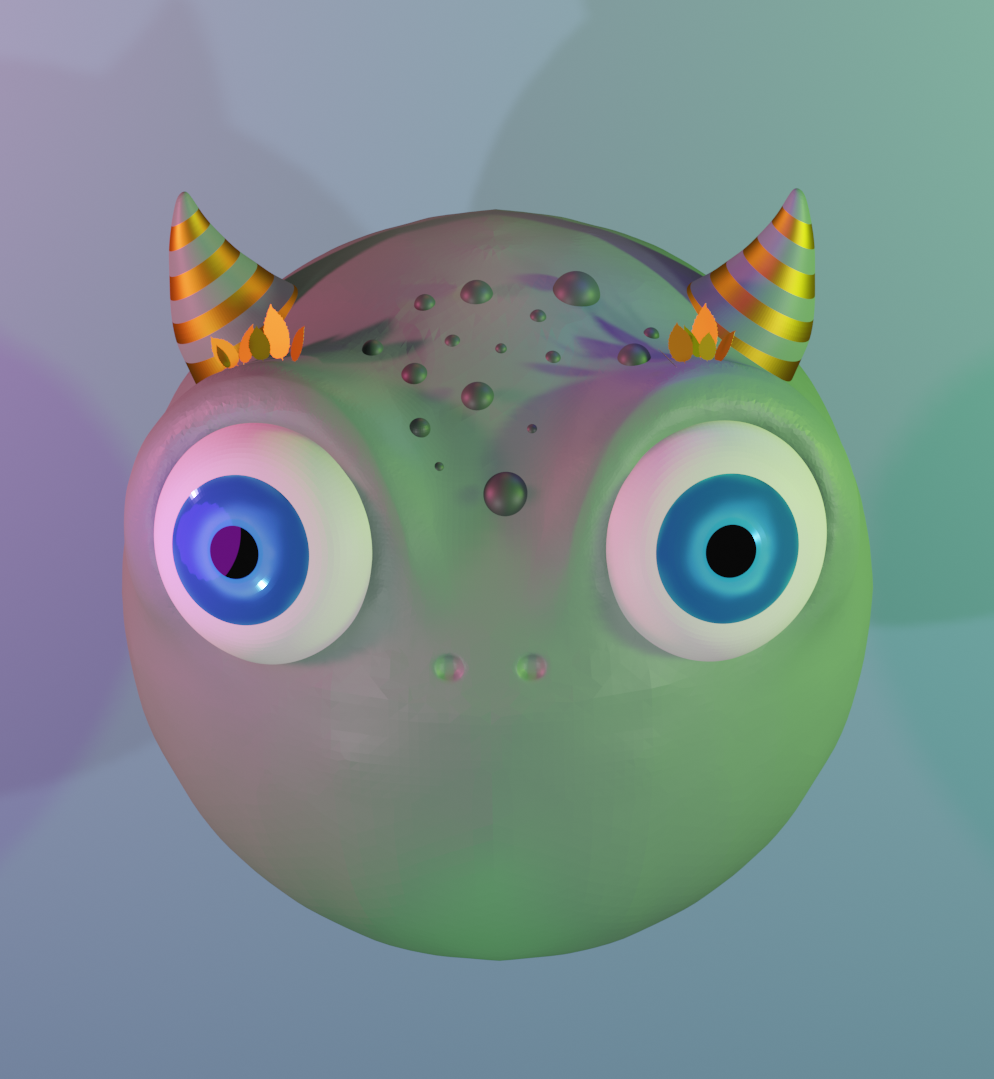
3D datapoint abstraction

2D design of the idea to understand the benefits of 3D and AR
Onboarding Experience
Initial prototype and the identified design problem
- Users need a way to see the actual capacity of water they can harvest, as all users cannot relate a large decimal value to actual visual amount.
- Users may get tired moving back and forth to look at overall visualisation and to select a data point respectively, it is therefore important to reduce human movement.
- Users may need to search for a suitable open space before starting an AR visualisation that supports occlusion or else a safe place if occlusion is not supported.
- Users need to know what is tappable in AR scene as on-screen buttons may not associate with current scene view all the time which can confuse the user.
- Users need to be engaged with the system during wait time, to reduce the perceived waiting time because users cannot wait long for an action to complete.
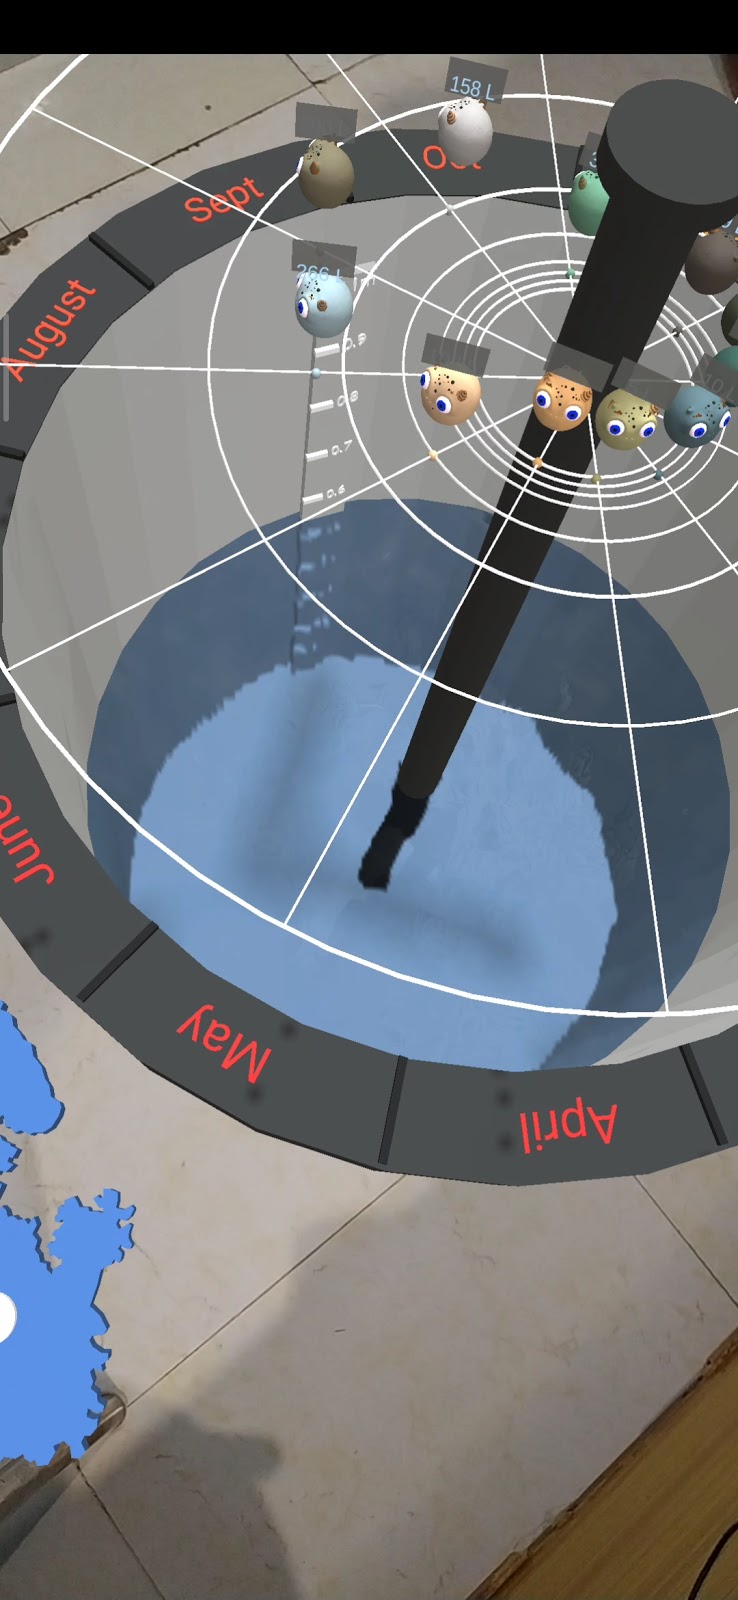
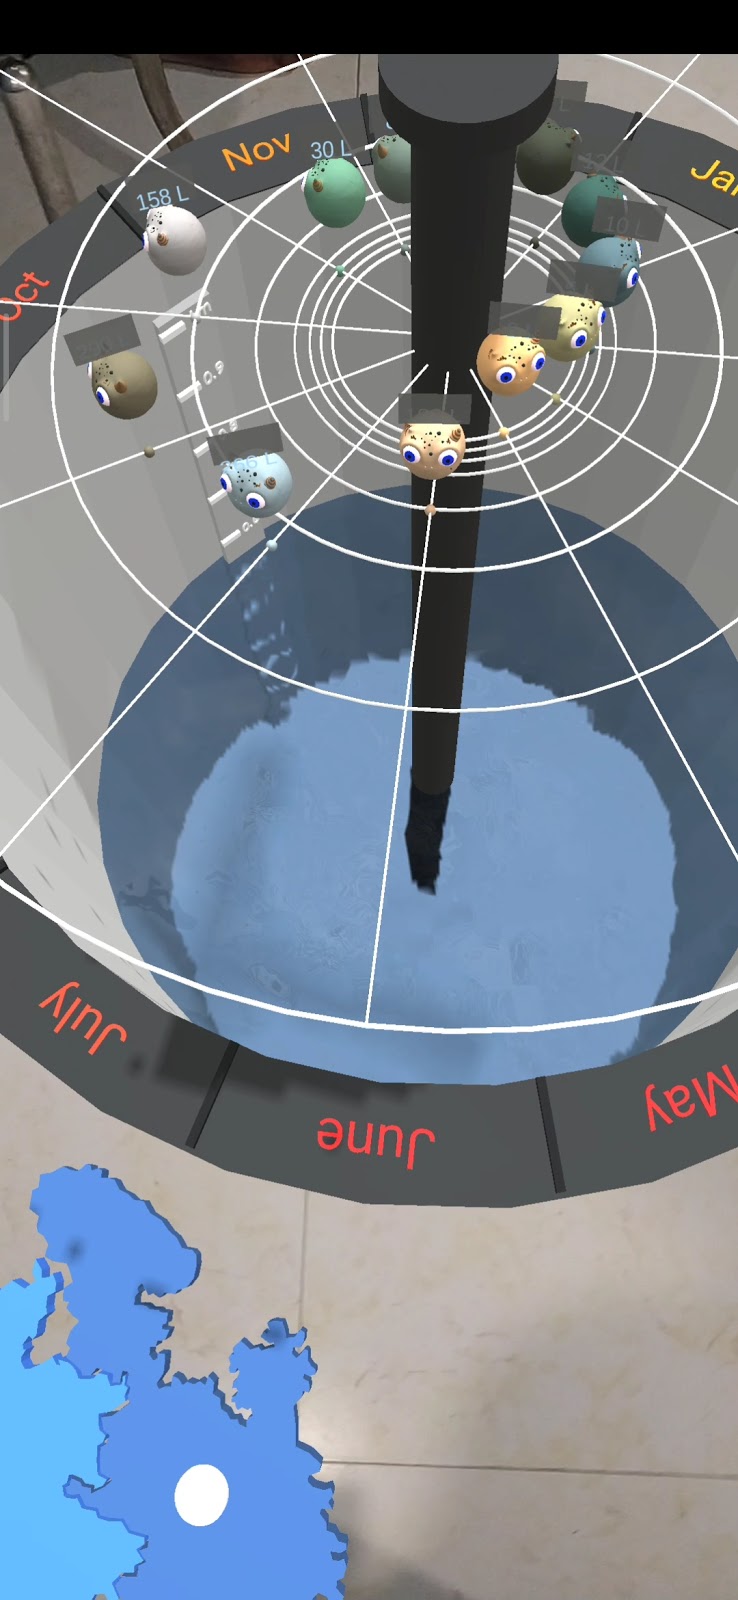
Final Prototype
Solution of the identifid design problems
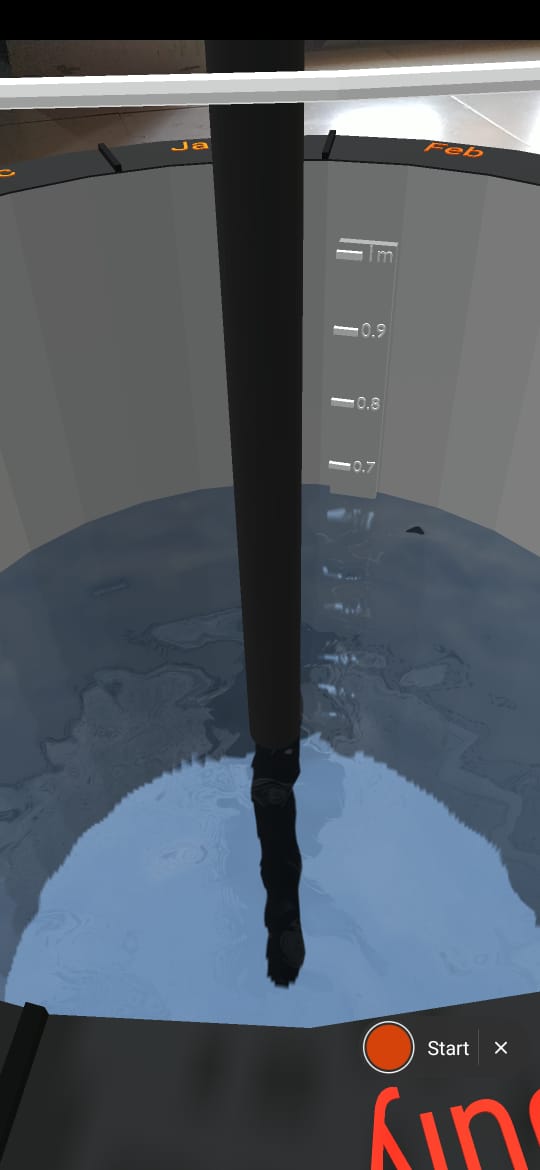
>>Users need a way to see the actual capacity of water they can harvest, as all users cannot relate a large decimal value to actual visual amount.
Solution:
- water well digged in the floor
- transparent water
- meter scale in the well
- water quantity labels
- water sound
>>Users need to know what is tappable in AR scene as on-screen buttons may not associate with current scene view all the time which can confuse the user.
Solution:
- an emotional expression
- a glow effect
- animation close to real world actions
- a tapping button animation


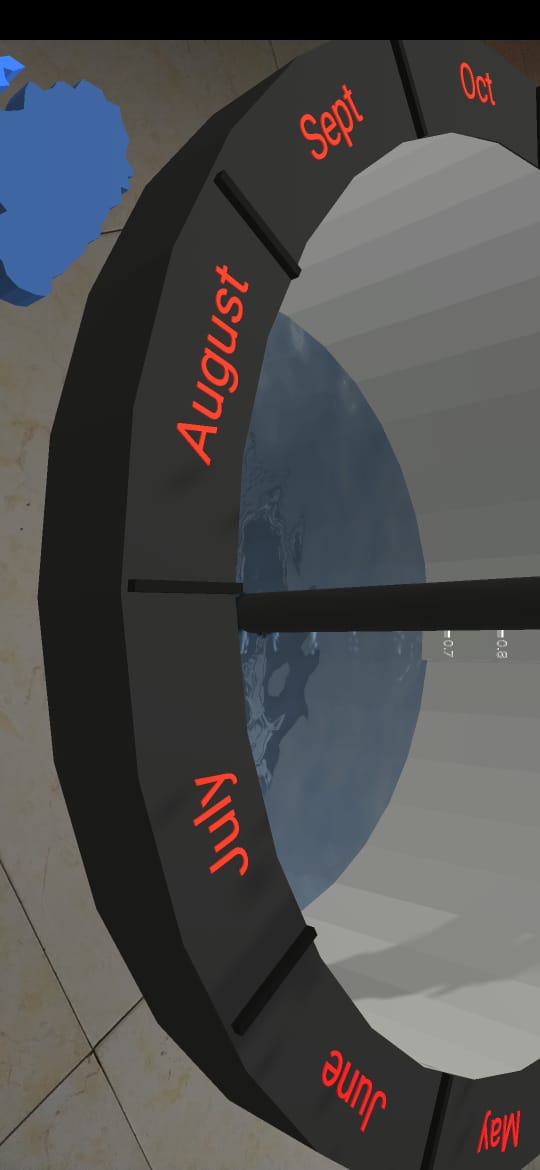
>>Users may get tired moving back and forth to look at overall visualisation and to select a data point respectively, it is therefore important to reduce human movement.
Solution:
- state map always in front of the camera and rotates around the well with camera on the floor
- the well can be rotated about the central axis to give easy access to all months
- the meter scale always faces the camera by rotating along the inner surface of well with camera
- Data values follows camera rotation
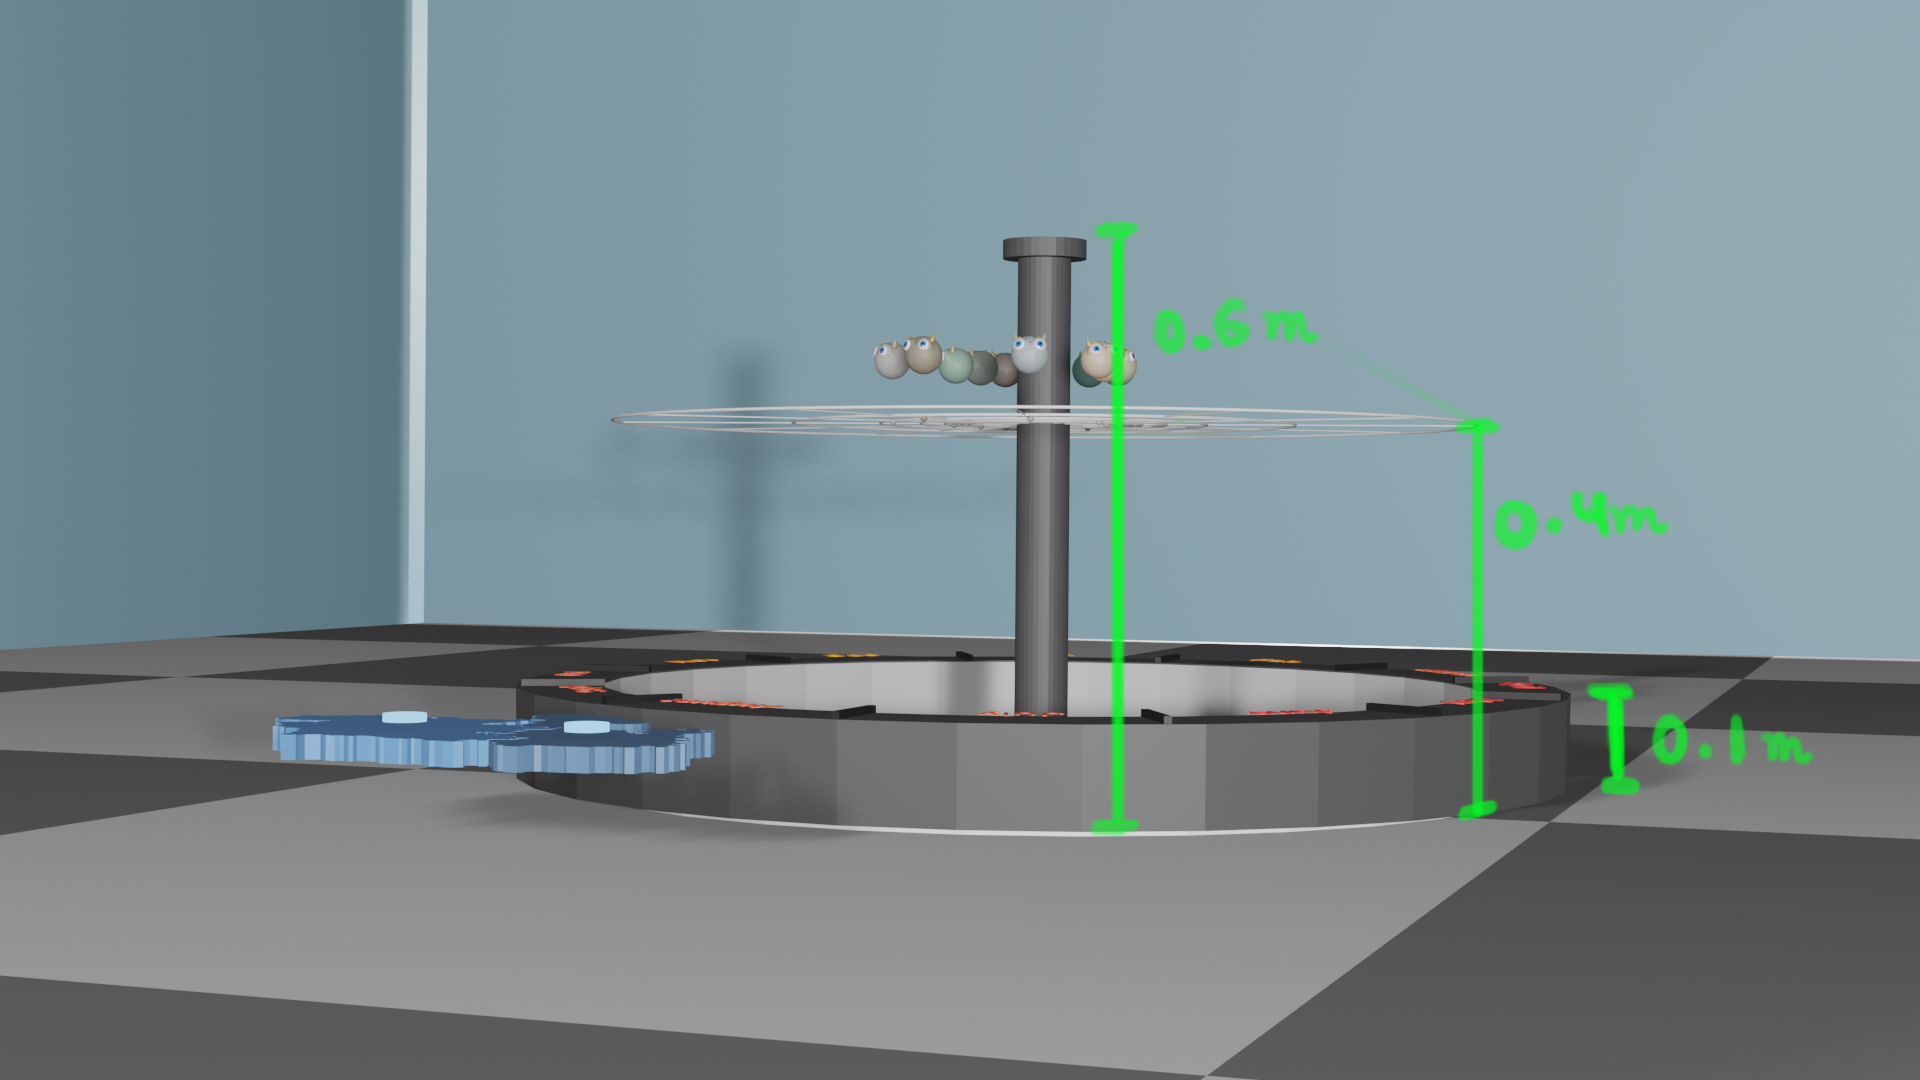
>>Users may need to search for a suitable open space before starting an AR visualisation that supports occlusion or else a safe place if occlusion is not supported.
Solution:
- The current visualisation is close to the ground level, keeping the safety of user in mind, where objects around and above the user is not hidden.
Note: This project was done as part of the M.Des summer internship.